

Why is Zoom stock down today? Soft Q3 profit guidance and support test

Zoom (ZM) stock is trading at $94.49 after a daily slide of 6.37%. The price is below its key moving averages and remains close to today's session low amid heightened volatility.
 99.98
99.98
99.98
99.98
Highlights
- Zoom reported fiscal second-quarter 2027 revenue of $1.28 billion and adjusted EPS of $1.55, both above analyst expectations.
- The company raised its full-year revenue guidance to $5.085 to $5.095 billion, supported by accelerated enterprise growth and AI product expansion.
- Shares of Zoom dropped 6.37% to $94.49, facing short- and medium-term bearish momentum and projected to trade between $90.76 and $102.29 over the next days.
Enterprise gains drive outlook upgrade despite persistent market pressure
Zoom reported its fiscal second-quarter 2027 results, with revenue rising 4.9% year over year to $1.28 billion and adjusted EPS of $1.55, both exceeding consensus expectations. The announcement was accompanied by an increased full-year revenue outlook to a range of $5.085 to $5.095 billion, reflecting confidence in recent enterprise growth trends. According to Finance Yahoo, Benzinga, and Marketscreener, the company's enterprise business saw its fastest expansion in three years on the back of AI adoption and a broader product portfolio, though price action has remained under broader selling pressure.
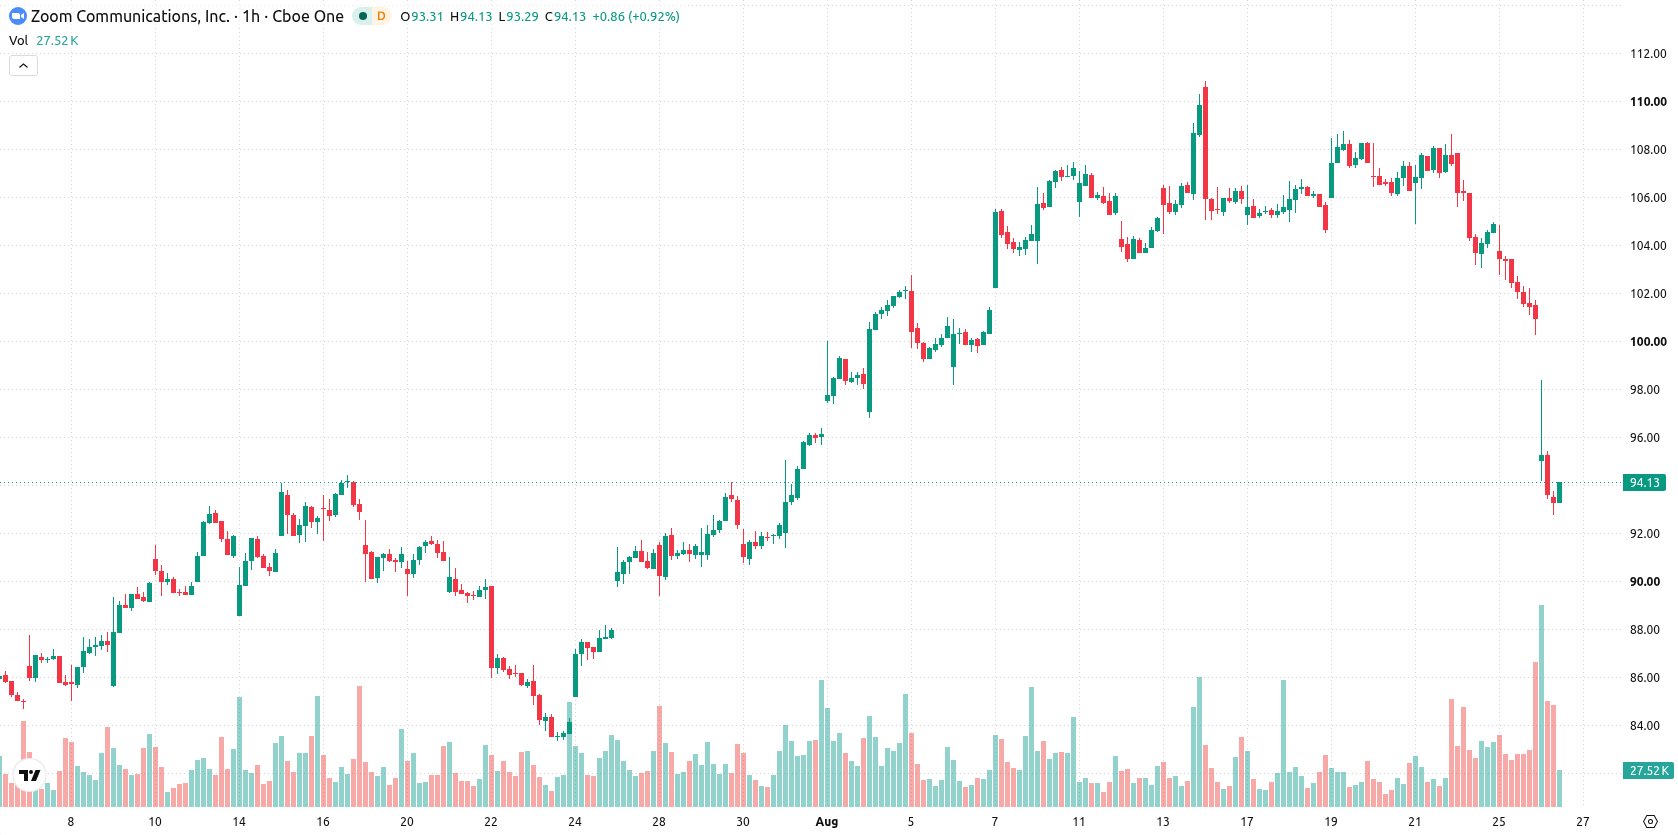
Sellers dominate momentum as price holds above long-term support
On the technical front, ZM/USD currently trades below the MA-20 ($104.73) and MA-50 ($105.75) levels, while maintaining a position above the MA-200 ($89.78) on the daily chart. The Ichimoku Kijun at $104.45 represents immediate resistance, and the short-term support is marked at $90.76. Momentum indicators are deeply negative: MACD and ADX both signal seller control, with RSI at 27.56, CCI, and Stochastic RSI all in oversold territory. Bull/Bear Power highlights strong dominance by sellers, while the Awesome Oscillator also confirms persistent downward momentum.
Downside risk persists as reversal hinges on technical breakout
In the short term, ZM is expected to consolidate within the $90.76 to $102.29 range over the next 2 to 3 trading days. The likelihood of an upward move is minimal, with downside risk remaining high and reversal scenarios appearing unlikely in the immediate term. If the price breaks below $90.76, it could trigger renewed selling pressure; a move above $104.45 would be required to open a recovery path.
Earlier, analysts noted that Zoom shares faced downward pressure despite strong second-quarter results and ongoing challenges in the competitive AI-driven software market. The current technical outlook reinforces a bearish scenario, with sellers firmly in control and $90.76 identified as a critical support level to monitor for potential renewed downside momentum.










-
 Afghanistan
-
 Albania
-
 Algeria
-
 Angola
-
 Argentina
-
 Armenia
-
 Australia
-
 Austria
-
 Azerbaijan
-
 Bahamas
-
 Bahrain
-
 Bangladesh
-
 Belarus
-
 Belgium
-
 Bolivia
-
 Botswana
-
 Brazil
-
 Brunei
-
 Bulgaria
-
 Cambodia
-
 Cameroon
-
 Canada
-
 Chile
Chile
-
 China
China
-
 Colombia
-
 Congo
Congo
-
 Costa Rica
-
 Cote d'Ivoire
-
 Croatia
-
 Cuba
Cuba
-
 Cyprus
-
 Czechia
-
 DR Congo
-
 Denmark
-
 Dominican Republic
-
 Ecuador
-
 Egypt
Egypt
-
 El Salvador
-
 Estonia
-
 Eswatini
-
 Ethiopia
-
 Finland
-
 France
-
 Georgia
-
 Germany
-
 Ghana
Ghana
-
 Greece
-
 Haiti
Haiti
-
 Hong Kong
-
 Hungary
-
 India
India
-
 Indonesia
-
 Iran, Islamic republic
-
 Iraq
Iraq
-
 Ireland
-
 Israel
-
 Italy
Italy
-
 Jamaica
-
 Japan
Japan
-
 Jordan
-
 Kazakhstan
-
 Kenya
Kenya
-
 Korea
Korea
-
 Kuwait
-
 Kyrgyzstan
-
 Laos
Laos
-
 Latvia
-
 Lebanon
-
 Lesotho
-
 Libya
Libya
-
 Lithuania
-
 Luxembourg
-
 Madagascar
-
 Malaysia
-
 Malta
Malta
-
 Mauritius
-
 Mexico
-
 Moldova
-
 Mongolia
-
 Montenegro
-
 Morocco
-
 Mozambique
-
 Myanmar
-
 Namibia
-
 Nepal
Nepal
-
 Netherlands
-
 New Zealand
-
 Nigeria
-
 North Macedonia
-
 Norway
-
 Oman
Oman
-
 Pakistan
-
 Palestine
-
 Panama
-
 Papua New Guinea
-
 Paraguay
-
 Peru
Peru
-
 Philippines
-
 Poland
-
 Portugal
-
 Puerto Rico
-
 Qatar
Qatar
-
 Reunion
-
 Romania
-
 Rwanda
-
 Saudi Arabia
-
 Serbia
-
 Singapore
-
 Slovakia
-
 Slovenia
-
 Somalia
-
 South Africa
-
 Spain
Spain
-
 Sri Lanka
-
 Sweden
-
 Switzerland
-
 Syria
Syria
-
 Taiwan
-
 Tajikistan
-
 Tanzania
-
 Thailand
-
 Trinidad and Tobago
-
 Tunisia
-
 Turkey
-
 UAE
UAE
-
 Uganda
-
 Ukraine
-
 United Kingdom
-
United States
-
 Uruguay
-
 Uzbekistan
-
 Venezuela
-
 Vietnam
-
 Yemen
Yemen
-
 Zambia
-
 Zimbabwe
- Forex
- Crypto












