


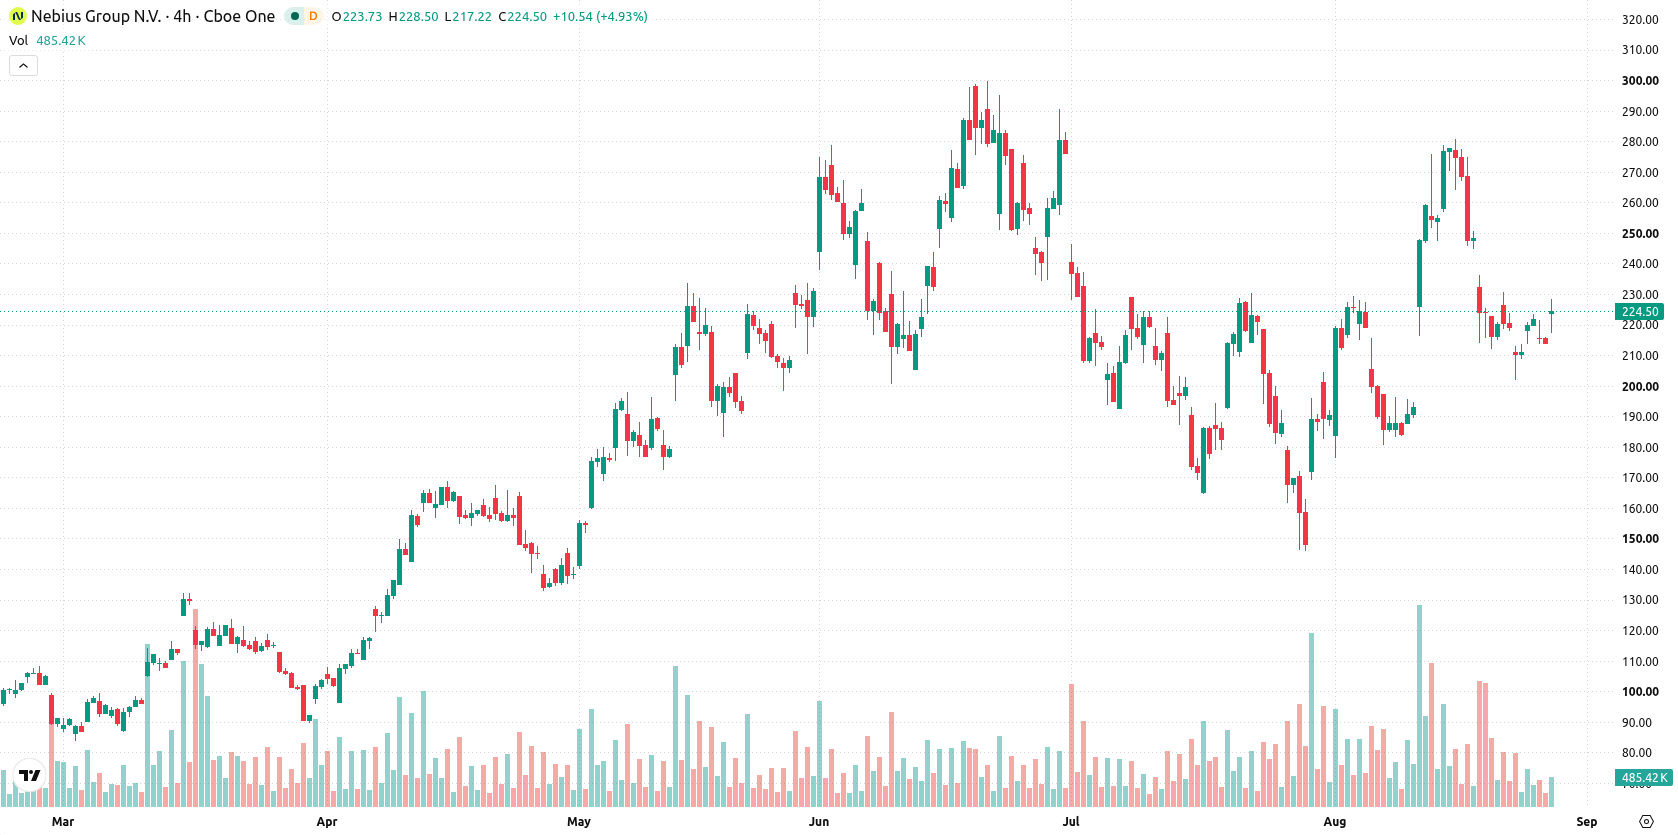
Nebius Group N.V. (NBIS) climbed 4.89% following strong revenue growth driven by robust demand in the AI and data center markets, highlighting the company's continued operational execution and earnings momentum. The advance is supported by the stock trading above its 20-day, 50-day, and 200-day moving averages, confirming bullish trends across short, medium, and long-term timeframes.
 178.33
182.74
Highlights
- Nebius Group reported strong revenue growth driven by elevated demand in artificial intelligence and data center sectors.
- The company maintains robust earnings and operational momentum within the expanding neocloud market, supported by continued hyperscaler investment.
- Shares of Nebius Group trade above key moving averages at $224.39, with the next support at $221.75 and resistance at $230.33, and the five-day forecast range at $210.17 to $238.61.
Hyperscaler investments fuel bullish sentiment amid neocloud expansion
Recent news highlights that Nebius Group reported significant revenue growth as a result of strong demand in the AI and data center sectors. The company is recognized for exceptional operational execution and robust earnings momentum within the neocloud market. This momentum is being driven by ongoing investments from hyperscalers.
Mixed technical signals emerge as bullish structure faces rising volatility
Nebius Group is trading above its 20-day, 50-day, and 200-day moving averages at $224.39, with the respective reference points at $220.55, $221.75, and $150.8. This clear positioning above key averages indicates a continued bullish trend across all major timeframes, and the alignment of the MA-50 above the MA-200 further supports a positive long-term outlook. Immediate technical levels include support near $221.75 and resistance at $230.33. Among momentum indicators, the MACD issues a strong buy signal and the ADX signals a neutral trend. However, the RSI at 48.6 sits close to neutral and suggests a 'Sell' bias, while the Stochastic RSI is deeply oversold at 18.88, signaling an oversold condition. Bull/Bear Power (BBP) is negative at -1.6, reflecting intraday selling pressure, and the Awesome Oscillator remains neutral. The stock is experiencing elevated intraday volatility at 3.68% and is trading near its daily high, although mixed momentum readings and oversold oscillators point to underlying divergences and urge caution for trend-following strategies.
Earlier, analysts noted that Nebius Group faced short- and medium-term selling pressure amid concerns over equity dilution, despite positive long-term fundamentals and robust AI contract growth. The current article signals a notable shift to a broadly bullish technical setup, and traders should monitor the $230.33 resistance for any sustained breakout that could trigger renewed upside momentum.






Latest Nebius Group N.V. News




-
 Afghanistan
-
 Albania
-
 Algeria
-
 Angola
-
 Argentina
-
 Armenia
-
 Australia
-
 Austria
-
 Azerbaijan
-
 Bahamas
-
 Bahrain
-
 Bangladesh
-
 Belarus
-
 Belgium
-
 Bolivia
-
 Botswana
-
 Brazil
-
 Brunei
-
 Bulgaria
-
 Cambodia
-
 Cameroon
-
 Canada
-
 Chile
-
 China
-
 Colombia
-
 Congo
-
 Costa Rica
-
 Cote d'Ivoire
-
 Croatia
-
 Cuba
-
 Cyprus
-
 Czechia
-
 DR Congo
-
 Denmark
-
 Dominican Republic
-
 Ecuador
-
 Egypt
-
 El Salvador
-
 Estonia
-
 Eswatini
-
 Ethiopia
-
 Finland
-
 France
-
 Georgia
-
 Germany
-
 Ghana
-
 Greece
-
 Haiti
-
 Hong Kong
-
 Hungary
-
 India
-
 Indonesia
-
 Iran, Islamic republic
-
 Iraq
-
 Ireland
-
 Israel
-
 Italy
-
 Jamaica
-
 Japan
-
 Jordan
-
 Kazakhstan
-
 Kenya
-
 Korea
-
 Kuwait
-
 Kyrgyzstan
-
 Laos
-
 Latvia
-
 Lebanon
-
 Lesotho
-
 Libya
-
 Lithuania
-
 Luxembourg
-
 Madagascar
-
 Malaysia
-
 Malta
-
 Mauritius
-
 Mexico
-
 Moldova
-
 Mongolia
-
 Montenegro
-
 Morocco
-
 Mozambique
-
 Myanmar
-
 Namibia
-
 Nepal
-
 Netherlands
-
 New Zealand
-
 Nigeria
-
 North Macedonia
-
 Norway
-
 Oman
-
 Pakistan
-
 Palestine
-
 Panama
-
 Papua New Guinea
-
 Paraguay
-
 Peru
-
 Philippines
-
 Poland
-
 Portugal
-
 Puerto Rico
-
 Qatar
-
 Reunion
-
 Romania
-
 Rwanda
-
 Saudi Arabia
-
 Serbia
-
 Singapore
-
 Slovakia
-
 Slovenia
-
 Somalia
-
 South Africa
-
 Spain
-
 Sri Lanka
-
 Sweden
-
 Switzerland
-
 Syria
-
 Taiwan
-
 Tajikistan
-
 Tanzania
-
 Thailand
-
 Trinidad and Tobago
-
 Tunisia
-
 Turkey
-
 UAE
-
 Uganda
-
 Ukraine
-
 United Kingdom
-
United States
-
 Uruguay
-
 Uzbekistan
-
 Venezuela
-
 Vietnam
-
 Yemen
-
 Zambia
-
 Zimbabwe
- Forex
- Crypto












