

Disney shares drop more than 2% after earnings beat and expanded buyback fail to boost sentiment

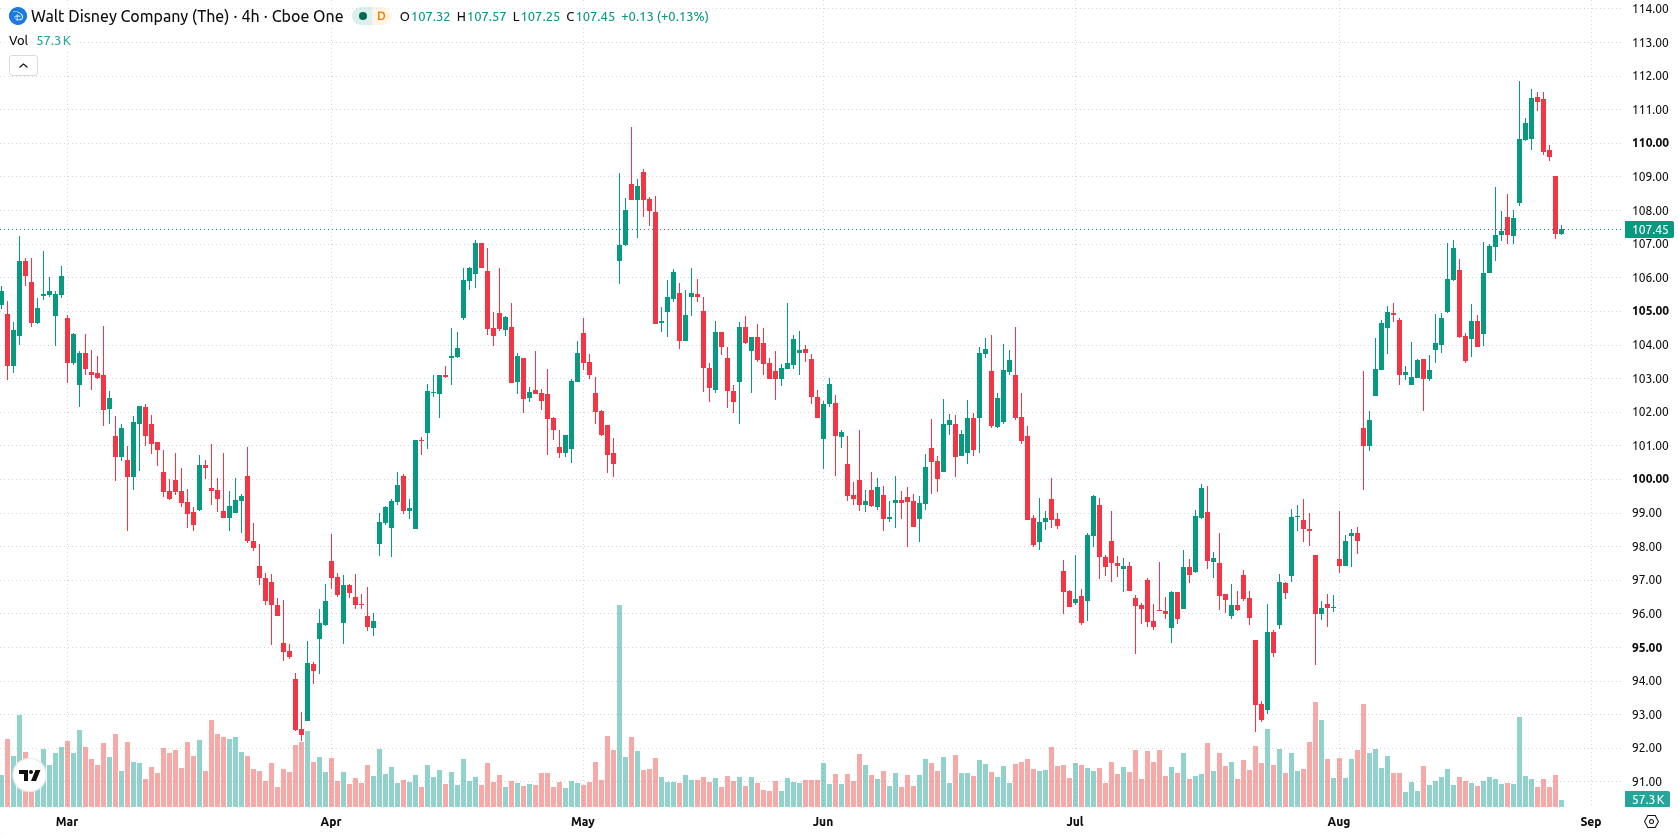
The Walt Disney Company (DIS) fell 2.00% after strong fiscal third-quarter results and an expanded share buyback program, even as bullish technical momentum was present. The drop occurred with Disney trading above its short-, medium-, and long-term moving averages, but overbought conditions and divergent intraday signals limit the move.
 111.88
112.30
Highlights
- Disney delivered fiscal Q3 2026 revenue of $25.25 billion and adjusted earnings per share of $2.06, with its experiences segment rising 10% to nearly $10 billion in revenue.
- The company expanded its share buyback authorization to $9 billion and projected double-digit adjusted EPS growth through fiscal 2027 with ongoing restructuring.
- Disney stock trades above key moving averages but is showing overbought conditions and downside volatility, with a projected 5-day range of $104.78 to $109.75.
Strong earnings and buyback fail to offset persistent selling pressure
Disney reported strong financial results for its fiscal third quarter of 2026, with revenue of $25.25 billion and adjusted earnings per share of $2.06. Its experiences segment recorded nearly $10 billion in revenue and $3 billion in operating income, reflecting 10% and 20% year-over-year growth. The company increased its buyback authorization to $9 billion and guided for double-digit adjusted EPS growth through fiscal 2027, accompanied by ongoing restructuring and workforce reductions. Disney's joint venture in India with Reliance Industries reported reduced losses, with its share of JV losses narrowing to $44 million in the June quarter, reflecting improved profitability in the region, though price action has remained under broader selling pressure.
Overbought technicals emerge despite mixed momentum and bullish trend
Disney is trading above its 20-day, 50-day, and 200-day moving averages ($103.58, $100.29, and $104.09 respectively), indicating bullish momentum in the short-, medium-, and long-term trends. The near-term ceiling at $107.58 and floor at $107.01 define the immediate support and resistance zone for the stock. Momentum signals are mixed. The Moving Average Convergence Divergence (MACD) and Awesome Oscillator (AO) show positive momentum, but the Average Directional Index (ADX) remains neutral. Multiple oscillators signal overbought conditions: Relative Strength Index (RSI) is at 70.72, Stochastic RSI is at 100, Commodity Channel Index (CCI) is 150.59, and Bull/Bear Power (BBP) at 5.44 shows buyers dominate the intraday tone, but all three are flashing overbought. Disney is currently at $107.37, down $2.19 or 2% on the day after a downside gap of roughly $1.68 (down 1.53%), trading near the session low with intraday volatility at 0.83%. Overbought signals are prominent even as daily action signals pressure after the open, and intraday momentum and oscillators show clear divergence.
Earlier, analysts noted that Disney's bullish technical structure was reinforced by strong financial results and an expanded share buyback program. The current developments add a layer of caution as overbought signals and divergent intraday momentum heighten the importance of monitoring the $107.01–$107.58 range for a potential breakout or reversal in the coming sessions.











-
 Afghanistan
-
 Albania
-
 Algeria
-
 Angola
-
 Argentina
-
 Armenia
-
 Australia
-
 Austria
-
 Azerbaijan
-
 Bahamas
-
 Bahrain
-
 Bangladesh
-
 Belarus
-
 Belgium
-
 Bolivia
-
 Botswana
-
 Brazil
-
 Brunei
-
 Bulgaria
-
 Cambodia
-
 Cameroon
-
 Canada
-
 Chile
-
 China
-
 Colombia
-
 Congo
-
 Costa Rica
-
 Cote d'Ivoire
-
 Croatia
-
 Cuba
-
 Cyprus
-
 Czechia
-
 DR Congo
-
 Denmark
-
 Dominican Republic
-
 Ecuador
-
 Egypt
-
 El Salvador
-
 Estonia
-
 Eswatini
-
 Ethiopia
-
 Finland
-
 France
-
 Georgia
-
 Germany
-
 Ghana
-
 Greece
-
 Haiti
-
 Hong Kong
-
 Hungary
-
 India
-
 Indonesia
-
 Iran, Islamic republic
-
 Iraq
-
 Ireland
-
 Israel
-
 Italy
-
 Jamaica
-
 Japan
-
 Jordan
-
 Kazakhstan
-
 Kenya
-
 Korea
-
 Kuwait
-
 Kyrgyzstan
-
 Laos
-
 Latvia
-
 Lebanon
-
 Lesotho
-
 Libya
-
 Lithuania
-
 Luxembourg
-
 Madagascar
-
 Malaysia
-
 Malta
-
 Mauritius
-
 Mexico
-
 Moldova
-
 Mongolia
-
 Montenegro
-
 Morocco
-
 Mozambique
-
 Myanmar
-
 Namibia
-
 Nepal
-
 Netherlands
-
 New Zealand
-
 Nigeria
-
 North Macedonia
-
 Norway
-
 Oman
-
 Pakistan
-
 Palestine
-
 Panama
-
 Papua New Guinea
-
 Paraguay
-
 Peru
-
 Philippines
-
 Poland
-
 Portugal
-
 Puerto Rico
-
 Qatar
-
 Reunion
-
 Romania
-
 Rwanda
-
 Saudi Arabia
-
 Serbia
-
 Singapore
-
 Slovakia
-
 Slovenia
-
 Somalia
-
 South Africa
-
 Spain
-
 Sri Lanka
-
 Sweden
-
 Switzerland
-
 Syria
-
 Taiwan
-
 Tajikistan
-
 Tanzania
-
 Thailand
-
 Trinidad and Tobago
-
 Tunisia
-
 Turkey
-
 UAE
-
 Uganda
-
 Ukraine
-
 United Kingdom
-
United States
-
 Uruguay
-
 Uzbekistan
-
 Venezuela
-
 Vietnam
-
 Yemen
-
 Zambia
-
 Zimbabwe
- Forex
- Crypto












