

TELUS shares fall nearly 2% as company slashes dividend and exits Dividend Aristocrats Index

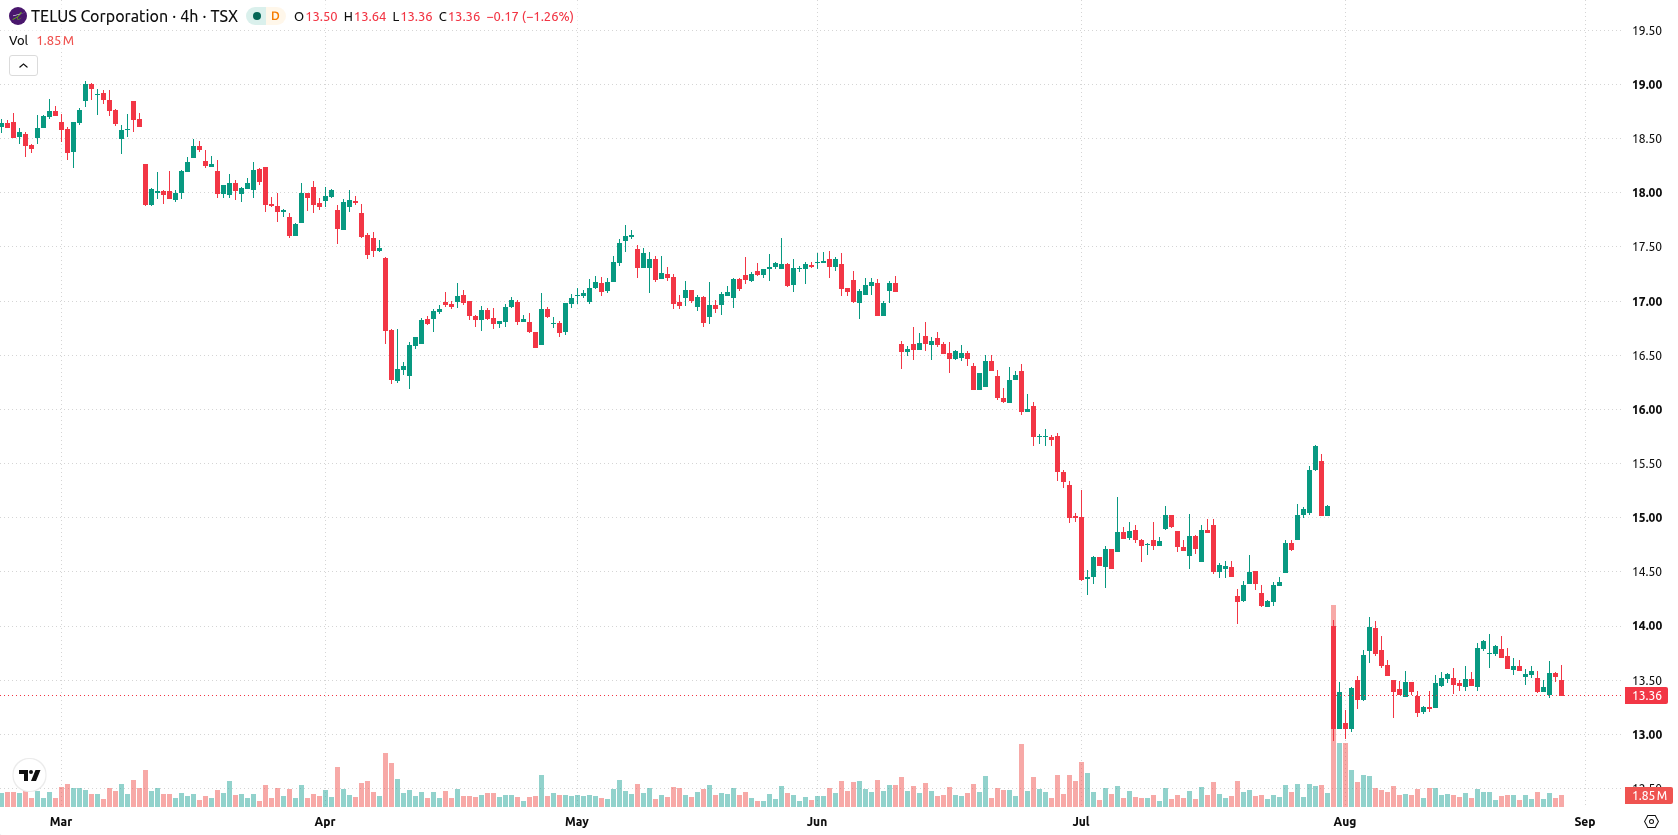
TELUS Corporation (T) fell 1.81% after confirming a substantial reduction to its quarterly dividend and removal from the S&P/TSX Canadian Dividend Aristocrats Index, moves tied to management's focus on balance sheet strength and leverage reduction. Persistent technical weakness supports the slide, with TELUS trading below all major moving averages and momentum signals reinforcing the prevailing downside pressure.
 13.91
12.65
Highlights
- TELUS announced a quarterly dividend cut of about 55%, reducing the payout to C$0.1875 per share starting October 1, 2026.
- The stock was removed from the S&P/TSX Canadian Dividend Aristocrats Index and adopted a new payout ratio policy to address higher leverage from recent network investments.
- Shares of TELUS trade below key moving averages with bearish momentum; the expected price range over the next five days is C$13.11 to C$13.53.
Index removal and lower payout reshape flows amid ongoing selloff
TELUS announced a significant cut to its quarterly dividend, reducing the payout by about 55% from C$0.41 to C$0.1875 per share, effective October 1, 2026. Following this, the company was removed from the S&P/TSX Canadian Dividend Aristocrats Index as it adopted a more conservative payout ratio of 45%–60% of free cash flow to address higher leverage from recent network investments. Institutional investor PDT Partners LLC acquired over 424,000 shares in the second quarter, though price action has remained under broader selling pressure.
Sustained bearish momentum as multiple indicators and levels diverge
TELUS is trading below the 20-day, 50-day, and 200-day moving averages at C$13.61, C$14.5, and C$17.13 respectively, reflecting clear short-, medium-, and long-term downside pressure. The Ichimoku Kijun resistance at C$14.31 confirms a bearish alignment in the prevailing trend, with the near-term ceiling at C$13.34 and floor at C$13.11 offering nearby technical reference points. Momentum readings are broadly bearish: Moving Average Convergence Divergence (MACD) signals a strong sell, and Average Directional Index (ADX) underscores seller control. The Relative Strength Index (RSI) reads 40.94 and leans toward a sell forecast, suggesting the stock is not in oversold territory yet. Stochastic RSI is higher at 66.79 and signals a buy, hinting at some rebound potential. Commodity Channel Index (CCI) is neutral, while Bull/Bear Power (BBP) at 0.05 indicates a slight dominance by buyers intraday. The Awesome Oscillator (AO) neutral reading shows lack of strong directional conviction. TELUS last traded at C$13.28, down C$0.245 or 1.81% for the day after a downside gap of approximately C$0.03 (0.22%). The price sits near the session low, with intraday volatility at 1.64% and a tone of continued pressure following the open. The divergence between momentum and some oscillators highlights an unsettled, choppy backdrop.
Earlier, analysts noted that while TELUS faced ongoing technical headwinds and dividend challenges, the stock's short-term setup suggested limited upside within a consolidation phase. The latest developments reinforce the broader downside risks, making the C$13.11 floor an essential level for traders to monitor for any signs of renewed selling momentum.










-
 Afghanistan
-
 Albania
-
 Algeria
-
 Angola
-
 Argentina
-
 Armenia
-
 Australia
-
 Austria
-
 Azerbaijan
-
 Bahamas
-
 Bahrain
-
 Bangladesh
-
 Belarus
-
 Belgium
-
 Bolivia
-
 Botswana
-
 Brazil
-
 Brunei
-
 Bulgaria
-
 Cambodia
-
 Cameroon
-
 Canada
-
 Chile
-
 China
-
 Colombia
-
 Congo
-
 Costa Rica
-
 Cote d'Ivoire
-
 Croatia
-
 Cuba
-
 Cyprus
-
 Czechia
-
 DR Congo
-
 Denmark
-
 Dominican Republic
-
 Ecuador
-
 Egypt
-
 El Salvador
-
 Estonia
-
 Eswatini
-
 Ethiopia
-
 Finland
-
 France
-
 Georgia
-
 Germany
-
 Ghana
-
 Greece
-
 Haiti
-
 Hong Kong
-
 Hungary
-
 India
-
 Indonesia
-
 Iran, Islamic republic
-
 Iraq
-
 Ireland
-
 Israel
-
 Italy
-
 Jamaica
-
 Japan
-
 Jordan
-
 Kazakhstan
-
 Kenya
-
 Korea
-
 Kuwait
-
 Kyrgyzstan
-
 Laos
-
 Latvia
-
 Lebanon
-
 Lesotho
-
 Libya
-
 Lithuania
-
 Luxembourg
-
 Madagascar
-
 Malaysia
-
 Malta
-
 Mauritius
-
 Mexico
-
 Moldova
-
 Mongolia
-
 Montenegro
-
 Morocco
-
 Mozambique
-
 Myanmar
-
 Namibia
-
 Nepal
-
 Netherlands
-
 New Zealand
-
 Nigeria
-
 North Macedonia
-
 Norway
-
 Oman
-
 Pakistan
-
 Palestine
-
 Panama
-
 Papua New Guinea
-
 Paraguay
-
 Peru
-
 Philippines
-
 Poland
-
 Portugal
-
 Puerto Rico
-
 Qatar
-
 Reunion
-
 Romania
-
 Rwanda
-
 Saudi Arabia
-
 Serbia
-
 Singapore
-
 Slovakia
-
 Slovenia
-
 Somalia
-
 South Africa
-
 Spain
-
 Sri Lanka
-
 Sweden
-
 Switzerland
-
 Syria
-
 Taiwan
-
 Tajikistan
-
 Tanzania
-
 Thailand
-
 Trinidad and Tobago
-
 Tunisia
-
 Turkey
-
 UAE
-
 Uganda
-
 Ukraine
-
 United Kingdom
-
United States
-
 Uruguay
-
 Uzbekistan
-
 Venezuela
-
 Vietnam
-
 Yemen
-
 Zambia
-
 Zimbabwe
- Forex
- Crypto












