

CoStar Group shares gain more than 3% after intraday buying strength and positive momentum signals

CoStar Group, Inc. (CSGP) surged 3.22% as strong technical momentum and early buying strength drove renewed demand. The move appears limited by the stock's ongoing position beneath its 200-day moving average, confirming the prevailing bearish long-term trend.
 31.36
32.21
Highlights
- CoStar Group stock trades above short- and medium-term averages, signaling strong near-term momentum with a recent 3.22% gain to $32.35.
- Technical indicators show mixed signals with overall bullish intraday bias, but some oscillators indicate possible limited further upside.
- Forecast projects a five-day trading range between $31.4 and $33.3, with 70% probability for a downward move and support at $32.18 and resistance at $33.23.
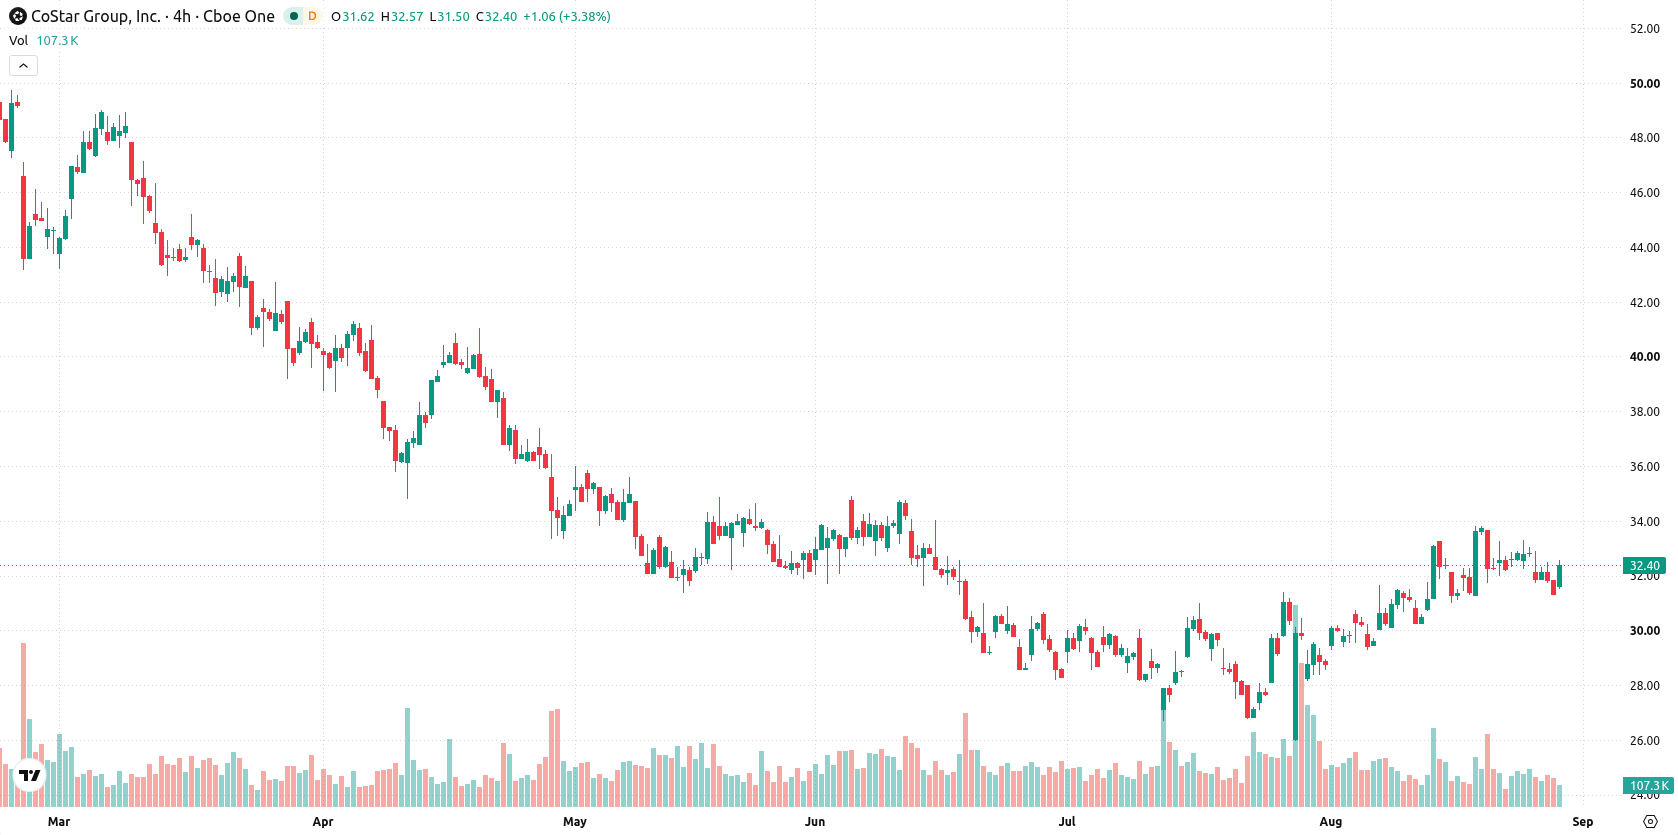
Bullish short-term momentum capped by long-term bearish structure
CoStar Group trades above the 20-day and 50-day moving averages ($31.36 and $30.06), indicating positive short- and medium-term momentum. However, the price remains below the 200-day moving average ($44.82), confirming a bearish long-term structure. The nearest resistance is at $33.23, with immediate support at $32.18. Momentum indicators show a mixed but overall bullish bias: the MACD signals strong buy momentum, the ADX is neutral, and the RSI points to a mild buy. Bull/Bear Power (BBP) above zero highlights dominant buyers intraday, though it also indicates overbought conditions. The Stochastic RSI signals local oversold, and the CCI is neutral. Intraday volatility is 2.06%, with trading near the session high. This combination reflects early buying strength and positive momentum, tempered by some oscillators flashing signals of limited further upside.
Earlier, analysts noted that CoStar Group was exhibiting strong short- and medium-term momentum despite remaining in a bearish long-term trend. The current outlook underscores this ongoing technical setup, with near-term consolidation expected and a potential shift hinging on a decisive move above or below the $33.23 resistance and $32.18 support levels.






Latest CoStar Group News




-
 Afghanistan
-
 Albania
-
 Algeria
-
 Angola
-
 Argentina
-
 Armenia
-
 Australia
-
 Austria
-
 Azerbaijan
-
 Bahamas
-
 Bahrain
-
 Bangladesh
-
 Belarus
-
 Belgium
-
 Bolivia
-
 Botswana
-
 Brazil
-
 Brunei
-
 Bulgaria
-
 Cambodia
-
 Cameroon
-
 Canada
-
 Chile
-
 China
-
 Colombia
-
 Congo
-
 Costa Rica
-
 Cote d'Ivoire
-
 Croatia
-
 Cuba
-
 Cyprus
-
 Czechia
-
 DR Congo
-
 Denmark
-
 Dominican Republic
-
 Ecuador
-
 Egypt
-
 El Salvador
-
 Estonia
-
 Eswatini
-
 Ethiopia
-
 Finland
-
 France
-
 Georgia
-
 Germany
-
 Ghana
-
 Greece
-
 Haiti
-
 Hong Kong
-
 Hungary
-
 India
-
 Indonesia
-
 Iran, Islamic republic
-
 Iraq
-
 Ireland
-
 Israel
-
 Italy
-
 Jamaica
-
 Japan
-
 Jordan
-
 Kazakhstan
-
 Kenya
-
 Korea
-
 Kuwait
-
 Kyrgyzstan
-
 Laos
-
 Latvia
-
 Lebanon
-
 Lesotho
-
 Libya
-
 Lithuania
-
 Luxembourg
-
 Madagascar
-
 Malaysia
-
 Malta
-
 Mauritius
-
 Mexico
-
 Moldova
-
 Mongolia
-
 Montenegro
-
 Morocco
-
 Mozambique
-
 Myanmar
-
 Namibia
-
 Nepal
-
 Netherlands
-
 New Zealand
-
 Nigeria
-
 North Macedonia
-
 Norway
-
 Oman
-
 Pakistan
-
 Palestine
-
 Panama
-
 Papua New Guinea
-
 Paraguay
-
 Peru
-
 Philippines
-
 Poland
-
 Portugal
-
 Puerto Rico
-
 Qatar
-
 Reunion
-
 Romania
-
 Rwanda
-
 Saudi Arabia
-
 Serbia
-
 Singapore
-
 Slovakia
-
 Slovenia
-
 Somalia
-
 South Africa
-
 Spain
-
 Sri Lanka
-
 Sweden
-
 Switzerland
-
 Syria
-
 Taiwan
-
 Tajikistan
-
 Tanzania
-
 Thailand
-
 Trinidad and Tobago
-
 Tunisia
-
 Turkey
-
 UAE
-
 Uganda
-
 Ukraine
-
 United Kingdom
-
United States
-
 Uruguay
-
 Uzbekistan
-
 Venezuela
-
 Vietnam
-
 Yemen
-
 Zambia
-
 Zimbabwe
- Forex
- Crypto












