

Affirm shares technical analysis: Support test at $66.52 in focus

Affirm Holdings, Inc. (AFRM) stock is trading at $72.93 after declining 6.31% on the session. The price closed below short- and medium-term moving averages but remains supported above its longer-term averages.
 60.09
67.50
Highlights
- Affirm reported record fiscal fourth quarter profitability, excluding a one-time tax allowance release, with improved operational efficiency and cost discipline.
- The company is growing its merchant network, expanding the Affirm Card, and deepening its partnership with Shopify via Shop Pay Installments in Australia.
- Shares of Affirm fell 6.31% to $72.93 with short- and medium-term technical signals remaining bearish and an expected trading range of $66.62 to $79.24 in the next 2 to 3 days.
Operational gains and new partnerships face sustained market skepticism
Affirm reported its most profitable fiscal fourth quarter on record, even after excluding a one-time tax allowance release, according to Fool. This underscores an improvement in operational efficiency and cost discipline, which can enhance future net income. Efforts to expand the merchant network and accelerate scale of the Affirm Card for offline transactions highlight ongoing diversification of revenue streams and payment channels, as noted by Fool. Additionally, Affirm and Shopify broadened their partnership by launching Shop Pay Installments in Australia, powered by Affirm and accessible via the Shop Pay button, according to Crowdfundinsider. All of these positive operational developments were recorded, though price action has remained under broader selling pressure.
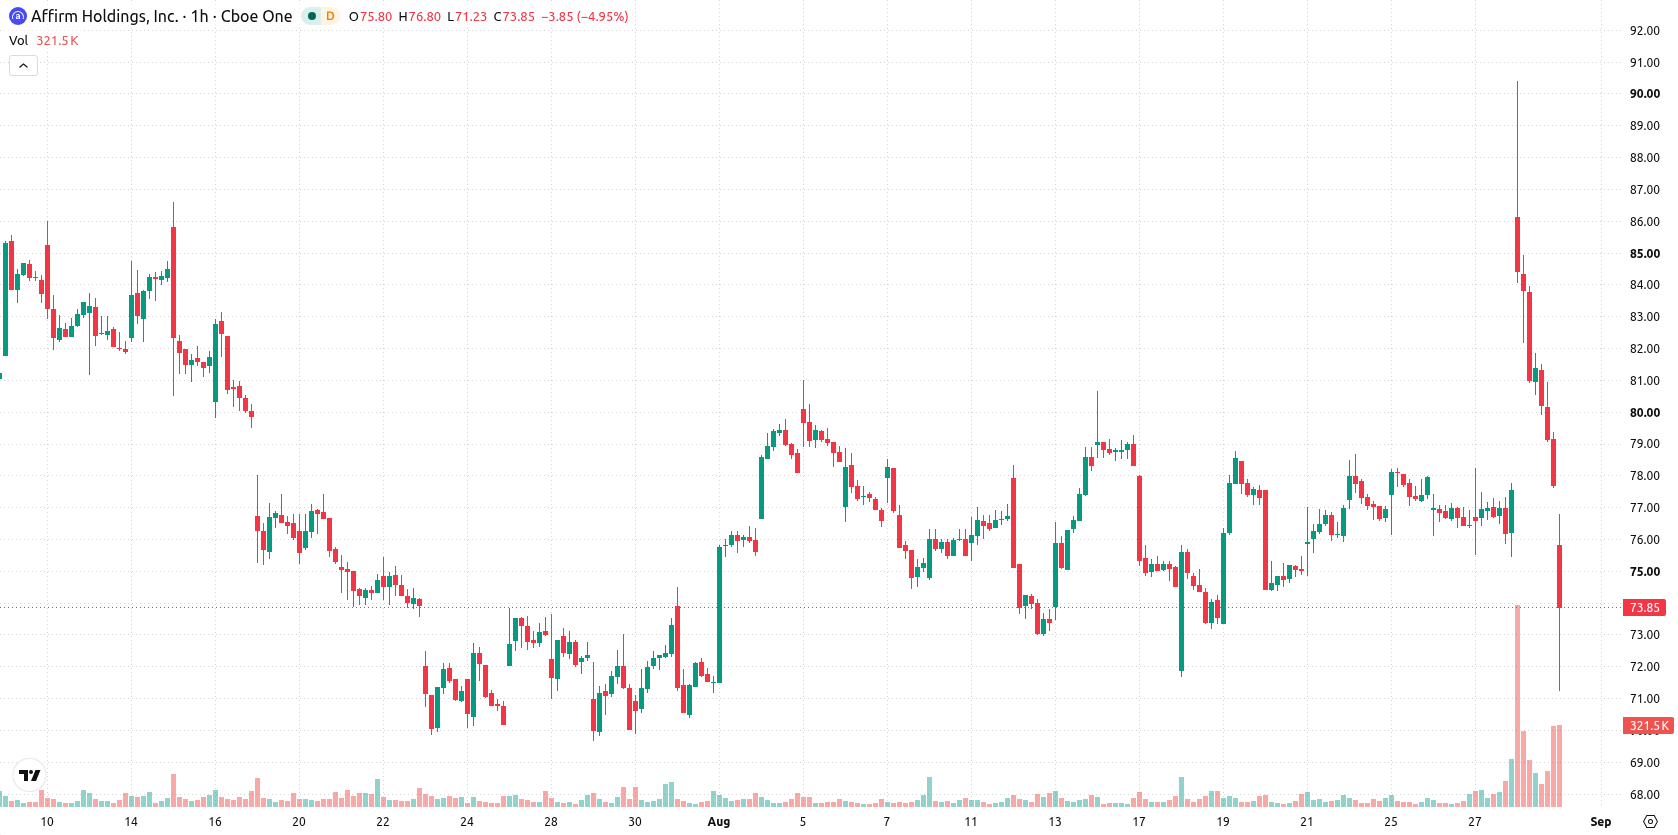
Mixed intraday signals as strong buying momentum clashes with oversold state
On the hourly chart, AFRM trades below its SMA-20 at $78.29 and SMA-50 at $77.26, while remaining supported above the SMA-200 at $66.52. The Ichimoku Kijun at $82.92 presents immediate resistance. Intraday indicators are mixed: MACD signals strong buy momentum and ADX remains in buy territory, but the RSI is at 47.37 (Sell), Stochastic RSI is oversold, and Bull/Bear Power points to seller dominance. Both CCI and Awesome Oscillator are neutral, reflecting a complex technical landscape with negative momentum but oversold conditions creating divergence.
Downside probability rises as price consolidates within defined band
For the next two to three trading days, the anticipated price range is $66.62 to $79.24, representing a typical volatility band relative to current levels. The probability model assigns a 30% chance of an upward move and a 70% likelihood of further downside, with consolidation in this corridor as the baseline scenario. A decisive break above $82.92 could trigger upside extension, while a move below $66.52 would risk accelerating declines.
Earlier, analysts noted that Affirm’s strong earnings performance and upgraded price targets reflected broad optimism about its operational trajectory following a recent earnings beat. The current technical environment, however, highlights consolidation risks and a 70% probability of downside, making $66.52 a critical support level for traders to monitor in the near term.






Latest Affirm News




-
 Afghanistan
-
 Albania
-
 Algeria
-
 Angola
-
 Argentina
-
 Armenia
-
 Australia
-
 Austria
-
 Azerbaijan
-
 Bahamas
-
 Bahrain
-
 Bangladesh
-
 Belarus
-
 Belgium
-
 Bolivia
-
 Botswana
-
 Brazil
-
 Brunei
-
 Bulgaria
-
 Cambodia
-
 Cameroon
-
 Canada
-
 Chile
-
 China
-
 Colombia
-
 Congo
-
 Costa Rica
-
 Cote d'Ivoire
-
 Croatia
-
 Cuba
-
 Cyprus
-
 Czechia
-
 DR Congo
-
 Denmark
-
 Dominican Republic
-
 Ecuador
-
 Egypt
-
 El Salvador
-
 Estonia
-
 Eswatini
-
 Ethiopia
-
 Finland
-
 France
-
 Georgia
-
 Germany
-
 Ghana
-
 Greece
-
 Haiti
-
 Hong Kong
-
 Hungary
-
 India
-
 Indonesia
-
 Iran, Islamic republic
-
 Iraq
-
 Ireland
-
 Israel
-
 Italy
-
 Jamaica
-
 Japan
-
 Jordan
-
 Kazakhstan
-
 Kenya
-
 Korea
-
 Kuwait
-
 Kyrgyzstan
-
 Laos
-
 Latvia
-
 Lebanon
-
 Lesotho
-
 Libya
-
 Lithuania
-
 Luxembourg
-
 Madagascar
-
 Malaysia
-
 Malta
-
 Mauritius
-
 Mexico
-
 Moldova
-
 Mongolia
-
 Montenegro
-
 Morocco
-
 Mozambique
-
 Myanmar
-
 Namibia
-
 Nepal
-
 Netherlands
-
 New Zealand
-
 Nigeria
-
 North Macedonia
-
 Norway
-
 Oman
-
 Pakistan
-
 Palestine
-
 Panama
-
 Papua New Guinea
-
 Paraguay
-
 Peru
-
 Philippines
-
 Poland
-
 Portugal
-
 Puerto Rico
-
 Qatar
-
 Reunion
-
 Romania
-
 Rwanda
-
 Saudi Arabia
-
 Serbia
-
 Singapore
-
 Slovakia
-
 Slovenia
-
 Somalia
-
 South Africa
-
 Spain
-
 Sri Lanka
-
 Sweden
-
 Switzerland
-
 Syria
-
 Taiwan
-
 Tajikistan
-
 Tanzania
-
 Thailand
-
 Trinidad and Tobago
-
 Tunisia
-
 Turkey
-
 UAE
-
 Uganda
-
 Ukraine
-
 United Kingdom
-
United States
-
 Uruguay
-
 Uzbekistan
-
 Venezuela
-
 Vietnam
-
 Yemen
-
 Zambia
-
 Zimbabwe
- Forex
- Crypto












