

What's behind Nebius Group's latest 4.3% stock pullback?

Nebius Group N.V. (NBIS) dropped 4.27% after the company's recently announced $5.75 billion convertible notes offering fueled concerns about potential shareholder dilution. The decline is reinforced by the stock's position below its 20-day and 50-day moving averages, signaling ongoing short- and medium-term selling pressure.
 161.42
182.45
Highlights
- Nebius Group authorized a $5.75 billion convertible notes offering and share buyback as insiders sold $46.3 million in shares.
- The company secured major new contracts averaging over $1 billion each with strong customer prepayments, but analysts downgraded the stock to Hold over valuation concerns.
- Shares of Nebius Group trade below short- and medium-term moving averages amid ongoing selling pressure, with a five-day forecast range of $184.3 to $210.8 and 63% probability for a downward move.
Insider selling and analyst downgrade amplify risk-off tech sector sentiment
Nebius Group recently announced a $5.75 billion convertible notes offering and a share buyback authorization, raising concerns about shareholder dilution. Insiders sold $46.3 million worth of shares, while major new contracts averaging over $1 billion each were secured and customer prepayments remained strong. The convertible offering and insider sales were accompanied by broader risk-off sentiment in the technology sector, with the company also recently experiencing a downgrade to 'Hold' as analysts questioned its valuation, though price action has remained under broader selling pressure.
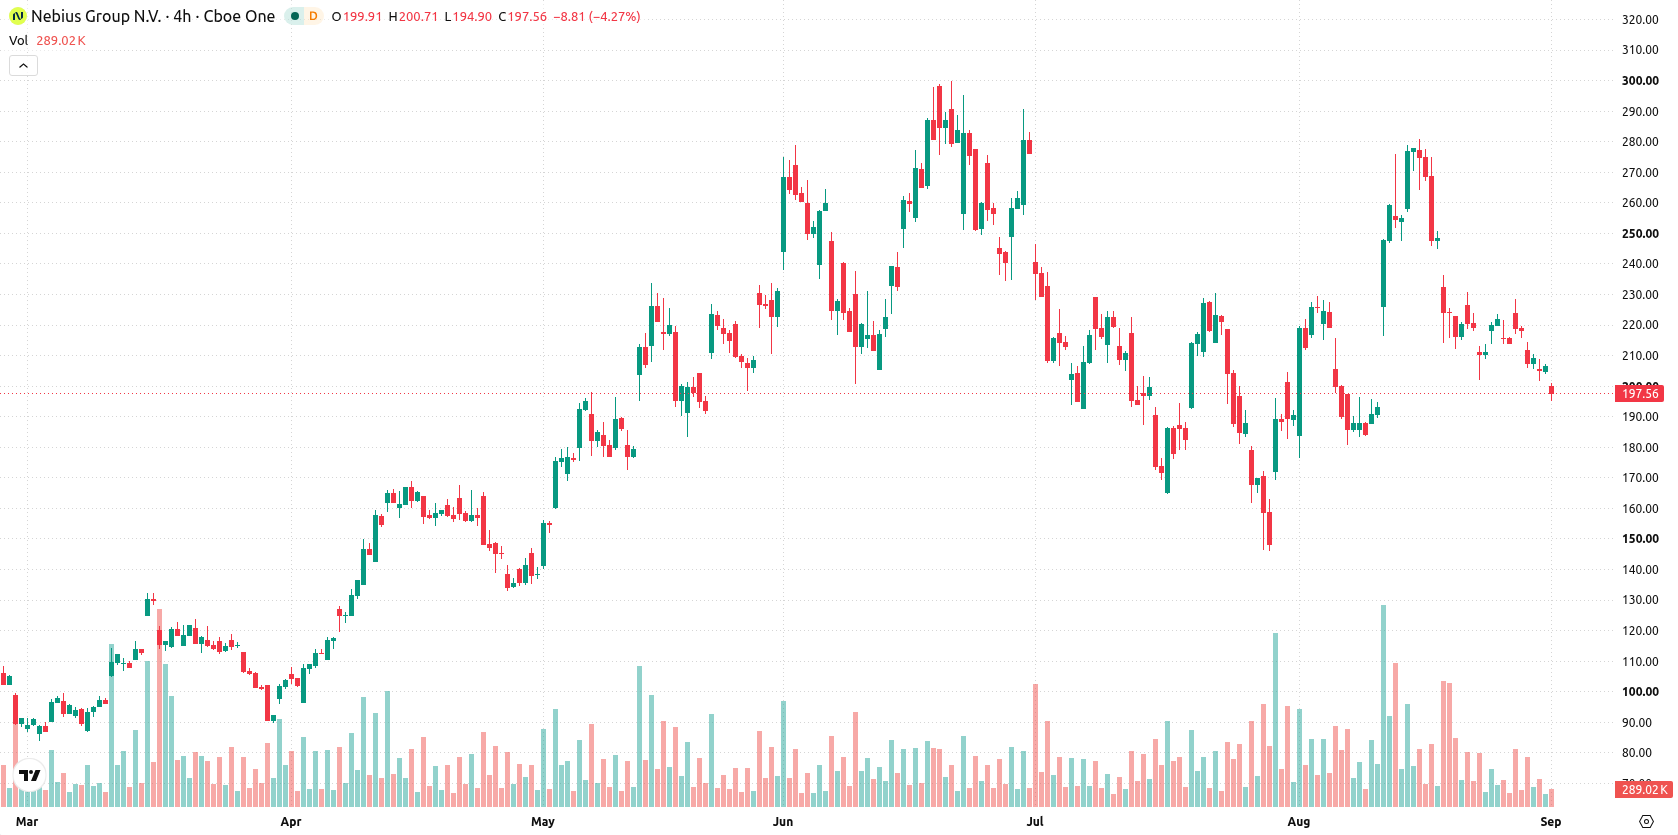
Sustained selling momentum as price holds above long-term support
Nebius Group is currently trading below its 20-day and 50-day moving averages, at $222.69 and $217.78 respectively, but remains above its 200-day moving average of $152.35. This setup highlights near-term and medium-term selling pressure, while a longer-term bullish structure persists based on the relationship between the MA-50 and MA-200. Immediate resistance lies at $199.97, with support at $195.1. Momentum readings show a negative short-term tilt: the RSI is at 46.38 and the CCI is at -61.99, both reflecting mild selling. The Stochastic RSI is at 0, indicating oversold conditions. Bull/Bear Power (BBP) at -10.64 confirms sellers are in control of the intraday session. Both MACD and ADX point to neutral momentum, suggesting trend strength is currently lacking. Nebius Group opened with a downside gap of about 3.1% and is mid-range for the day, marking a $8.82 (4.27%) decline on above-average intraday volatility of 2.50%. Price action is currently characterized by sustained pressure after the open, aligning with negative momentum signals.
Earlier, analysts noted that Nebius Group's long-term bullish momentum was countered by persistent short- and medium-term technical weakness. The current analysis strengthens this view, highlighting a prevailing scenario of sideways trading with a risk of further downside if support at $195.1 gives way.






Latest Nebius Group N.V. News




-
 Afghanistan
-
 Albania
-
 Algeria
-
 Angola
-
 Argentina
-
 Armenia
-
 Australia
-
 Austria
-
 Azerbaijan
-
 Bahamas
-
 Bahrain
-
 Bangladesh
-
 Belarus
-
 Belgium
-
 Bolivia
-
 Botswana
-
 Brazil
-
 Brunei
-
 Bulgaria
-
 Cambodia
-
 Cameroon
-
 Canada
-
 Chile
-
 China
-
 Colombia
-
 Congo
-
 Costa Rica
-
 Cote d'Ivoire
-
 Croatia
-
 Cuba
-
 Cyprus
-
 Czechia
-
 DR Congo
-
 Denmark
-
 Dominican Republic
-
 Ecuador
-
 Egypt
-
 El Salvador
-
 Estonia
-
 Eswatini
-
 Ethiopia
-
 Finland
-
 France
-
 Georgia
-
 Germany
-
 Ghana
-
 Greece
-
 Haiti
-
 Hong Kong
-
 Hungary
-
 India
-
 Indonesia
-
 Iran, Islamic republic
-
 Iraq
-
 Ireland
-
 Israel
-
 Italy
-
 Jamaica
-
 Japan
-
 Jordan
-
 Kazakhstan
-
 Kenya
-
 Korea
-
 Kuwait
-
 Kyrgyzstan
-
 Laos
-
 Latvia
-
 Lebanon
-
 Lesotho
-
 Libya
-
 Lithuania
-
 Luxembourg
-
 Madagascar
-
 Malaysia
-
 Malta
-
 Mauritius
-
 Mexico
-
 Moldova
-
 Mongolia
-
 Montenegro
-
 Morocco
-
 Mozambique
-
 Myanmar
-
 Namibia
-
 Nepal
-
 Netherlands
-
 New Zealand
-
 Nigeria
-
 North Macedonia
-
 Norway
-
 Oman
-
 Pakistan
-
 Palestine
-
 Panama
-
 Papua New Guinea
-
 Paraguay
-
 Peru
-
 Philippines
-
 Poland
-
 Portugal
-
 Puerto Rico
-
 Qatar
-
 Reunion
-
 Romania
-
 Rwanda
-
 Saudi Arabia
-
 Serbia
-
 Singapore
-
 Slovakia
-
 Slovenia
-
 Somalia
-
 South Africa
-
 Spain
-
 Sri Lanka
-
 Sweden
-
 Switzerland
-
 Syria
-
 Taiwan
-
 Tajikistan
-
 Tanzania
-
 Thailand
-
 Trinidad and Tobago
-
 Tunisia
-
 Turkey
-
 UAE
-
 Uganda
-
 Ukraine
-
 United Kingdom
-
United States
-
 Uruguay
-
 Uzbekistan
-
 Venezuela
-
 Vietnam
-
 Yemen
-
 Zambia
-
 Zimbabwe
- Forex
- Crypto












