

Costco shares weekly forecast: Consolidation persists as ADX and momentum remain mixed

Shares of Costco Wholesale Corporation (COST) are trading near $944 as the stock struggles to hold support at the lower end of its recent range. Despite subdued movement this week, consolidation remains the key dynamic, with corporate developments setting the tone for sentiment heading into next week.
 1021.17
Highlights
- Shares of Costco closed at $943.78, trading just below key short-term and medium-term moving averages.
- The stock shows a flat trend and remains in a narrow weekly range with volatility at 3.64%.
- Support is at $933.35 and resistance at $945.64, with price action likely to stay in a $925.49 to $958.95 range and high probability of further decline.
Growth initiatives and new investment fuel sentiment over the week
Costco attracted attention after Portfolio Design Labs LLC made a new institutional investment of approximately $2.56 million, according to Ticker Report. Recent fiscal Q3 2026 results brought double-digit revenue growth and a fresh Medicare partnership, reflecting the company's ongoing growth initiatives, as reported by Ad-hoc-news.de. In addition, Yahoo Finance and The Motley Fool highlighted robust dividend growth and discussions about slower in-store visits, keeping investor focus on evolving business drivers for the week ahead.
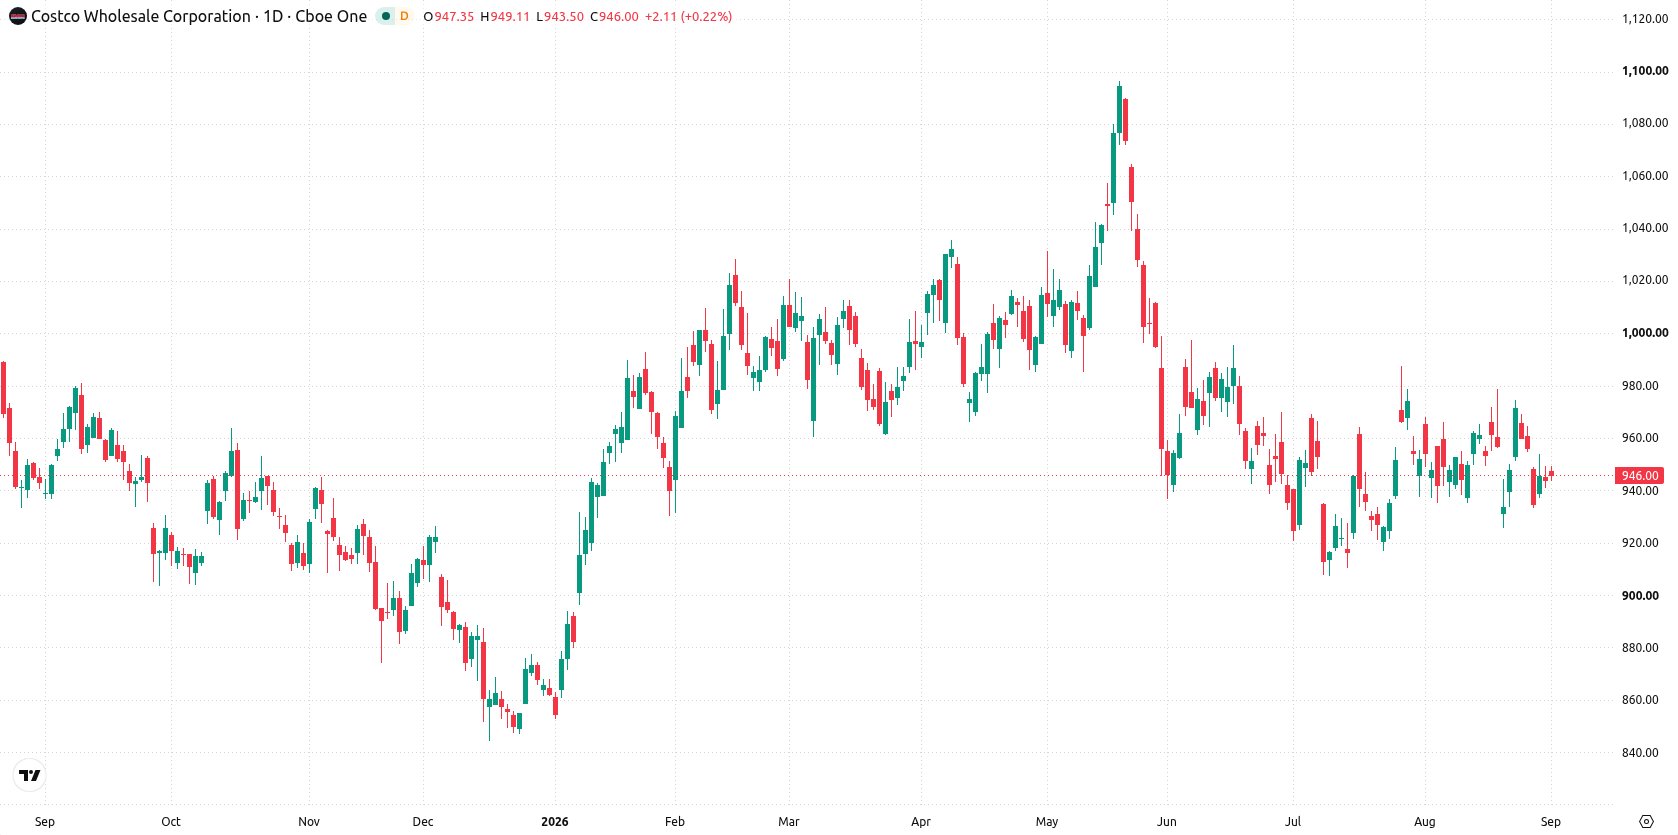
Flat technical trend with mixed momentum signals this week
On the daily chart, Costco stock displays a flat trend with a contained move within a narrow range, while volatility over the past 7 days was 3.64%. Momentum remains mixed: RSI at 47.48 is neutral and Bull/Bear Power has slipped into an oversold state, signaling some seller dominance even as the ADX forecast is neutral. The nearest support sits at $933.35, with immediate resistance at $945.64 as the stock tests its MA-50. The Ichimoku Kijun at $956.66 also acts as a secondary overhead barrier, keeping any recovery attempts in check for now.
Consolidation likely as downside risk outweighs upside next week
Next week, the expected range is $925.49 to $958.95, with a very high probability of a decrease and a very low probability of an increase. The base case is continued consolidation between $933.35 and $945.64, where most price action should cluster. A break above $945.64 would open the door to testing $956.66, while a drop below $933.35 risks extending losses toward the lower boundary of the expected range.
Earlier, analysts noted that high-quality, cash-generating companies with a track record of stable profitability tended to outperform during periods of market uncertainty and legislative gridlock. Costco's current technical consolidation, paired with evidence of institutional accumulation and fresh partnerships, now puts focus on whether the $933.35 support level will hold or give way to further downside in the coming sessions.











-
 Afghanistan
-
 Albania
-
 Algeria
-
 Angola
-
 Argentina
-
 Armenia
-
 Australia
-
 Austria
-
 Azerbaijan
-
 Bahamas
-
 Bahrain
-
 Bangladesh
-
 Belarus
-
 Belgium
-
 Bolivia
-
 Botswana
-
 Brazil
-
 Brunei
-
 Bulgaria
-
 Cambodia
-
 Cameroon
-
 Canada
-
 Chile
-
 China
-
 Colombia
-
 Congo
-
 Costa Rica
-
 Cote d'Ivoire
-
 Croatia
-
 Cuba
-
 Cyprus
-
 Czechia
-
 DR Congo
-
 Denmark
-
 Dominican Republic
-
 Ecuador
-
 Egypt
-
 El Salvador
-
 Estonia
-
 Eswatini
-
 Ethiopia
-
 Finland
-
 France
-
 Georgia
-
 Germany
-
 Ghana
-
 Greece
-
 Haiti
-
 Hong Kong
-
 Hungary
-
 India
-
 Indonesia
-
 Iran, Islamic republic
-
 Iraq
-
 Ireland
-
 Israel
-
 Italy
-
 Jamaica
-
 Japan
-
 Jordan
-
 Kazakhstan
-
 Kenya
-
 Korea
-
 Kuwait
-
 Kyrgyzstan
-
 Laos
-
 Latvia
-
 Lebanon
-
 Lesotho
-
 Libya
-
 Lithuania
-
 Luxembourg
-
 Madagascar
-
 Malaysia
-
 Malta
-
 Mauritius
-
 Mexico
-
 Moldova
-
 Mongolia
-
 Montenegro
-
 Morocco
-
 Mozambique
-
 Myanmar
-
 Namibia
-
 Nepal
-
 Netherlands
-
 New Zealand
-
 Nigeria
-
 North Macedonia
-
 Norway
-
 Oman
-
 Pakistan
-
 Palestine
-
 Panama
-
 Papua New Guinea
-
 Paraguay
-
 Peru
-
 Philippines
-
 Poland
-
 Portugal
-
 Puerto Rico
-
 Qatar
-
 Reunion
-
 Romania
-
 Rwanda
-
 Saudi Arabia
-
 Serbia
-
 Singapore
-
 Slovakia
-
 Slovenia
-
 Somalia
-
 South Africa
-
 Spain
-
 Sri Lanka
-
 Sweden
-
 Switzerland
-
 Syria
-
 Taiwan
-
 Tajikistan
-
 Tanzania
-
 Thailand
-
 Trinidad and Tobago
-
 Tunisia
-
 Turkey
-
 UAE
-
 Uganda
-
 Ukraine
-
 United Kingdom
-
United States
-
 Uruguay
-
 Uzbekistan
-
 Venezuela
-
 Vietnam
-
 Yemen
-
 Zambia
-
 Zimbabwe
- Forex
- Crypto












