

Rogers Communication stock price prediction: Flat as buyers support $36.37

Rogers Communication (RCI) stock is trading at $36.82, experiencing a slight decline in today’s session and currently standing near the session's low. The price maintains a position above its key moving averages, indicating continued upward pressure across multiple timeframes in a moderate volatility environment.
Highlights
- RCI/USD trades above key short- and long-term moving averages, maintaining upward pressure on multiple timeframes.
- Momentum and oscillators predominantly show a buy bias, with no significant overbought or oversold signals currently present.
- Price sits at $36.82, with an expected 2 to 3 day trading range of $36.37 to $37.27 and a high probability of upward movement.
Mixed short-term momentum with price holding against intraday divergence
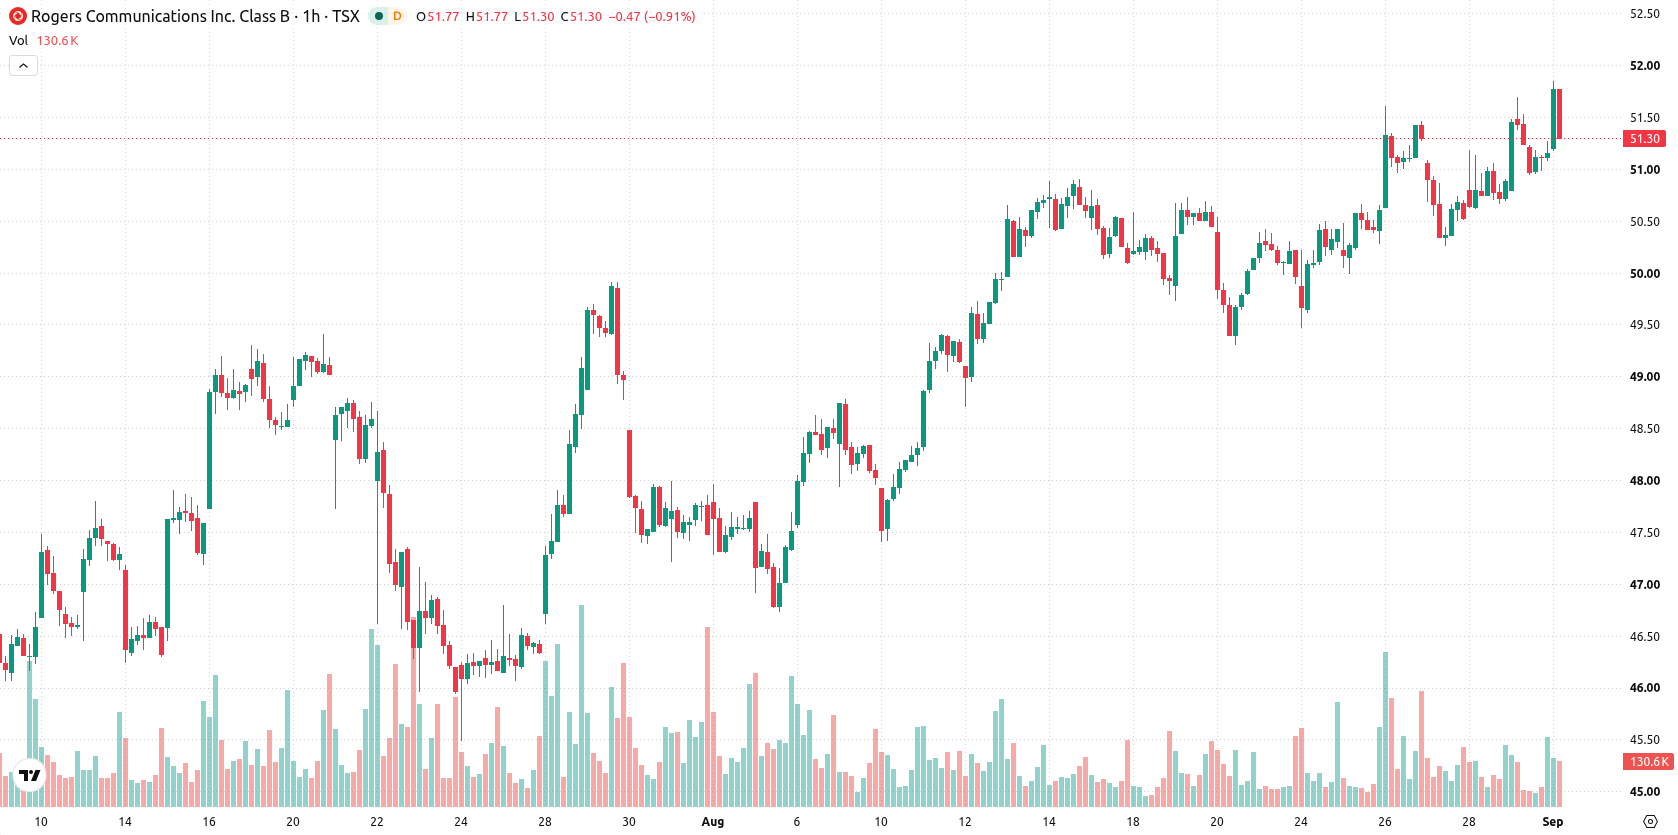
On the technical front, RCI trades above the MA-20 and MA-50 on the hourly timeframe as well as above the MA-200 on the daily chart, with the Ichimoku Kijun at $36.77 offering immediate support. Momentum indicators present a mixed short-term outlook: both MACD and ADX lean positive, while RSI and CCI signal buying conditions without significant overbought or oversold readings. Stochastic RSI is neutral and the Awesome Oscillator provides no directional confirmation. Bull/Bear Power shows intraday buyer dominance, but today's modest downside move suggests mild short-term divergence between price and underlying momentum.
Volatility band narrows as consolidation limits directional risk
In the next 2 to 3 days, RCI is expected to remain within a typical volatility band ranging from $36.37 to $37.27. The baseline scenario favors further consolidation within this corridor. A bullish scenario would be triggered by a breakout above the $37.27 resistance level, signaling continued upward momentum. Conversely, a drop below the $36.37 support would open the way for additional short-term downside.
Earlier, analysts noted that Rogers Communications was displaying sideways consolidation with mixed technical indicators signaling short-term uncertainty. The current analysis supports this view, emphasizing consolidation within a defined band and highlighting the $37.27 resistance as the key level for a potential upside move in the coming days.









-
 Afghanistan
-
 Albania
-
 Algeria
-
 Angola
-
 Argentina
-
 Armenia
-
 Australia
-
 Austria
-
 Azerbaijan
-
 Bahamas
-
 Bahrain
-
 Bangladesh
-
 Belarus
-
 Belgium
-
 Bolivia
-
 Botswana
-
 Brazil
-
 Brunei
-
 Bulgaria
-
 Cambodia
-
 Cameroon
-
 Canada
-
 Chile
-
 China
-
 Colombia
-
 Congo
-
 Costa Rica
-
 Cote d'Ivoire
-
 Croatia
-
 Cuba
-
 Cyprus
-
 Czechia
-
 DR Congo
-
 Denmark
-
 Dominican Republic
-
 Ecuador
-
 Egypt
-
 El Salvador
-
 Estonia
-
 Eswatini
-
 Ethiopia
-
 Finland
-
 France
-
 Georgia
-
 Germany
-
 Ghana
-
 Greece
-
 Haiti
-
 Hong Kong
-
 Hungary
-
 India
-
 Indonesia
-
 Iran, Islamic republic
-
 Iraq
-
 Ireland
-
 Israel
-
 Italy
-
 Jamaica
-
 Japan
-
 Jordan
-
 Kazakhstan
-
 Kenya
-
 Korea
-
 Kuwait
-
 Kyrgyzstan
-
 Laos
-
 Latvia
-
 Lebanon
-
 Lesotho
-
 Libya
-
 Lithuania
-
 Luxembourg
-
 Madagascar
-
 Malaysia
-
 Malta
-
 Mauritius
-
 Mexico
-
 Moldova
-
 Mongolia
-
 Montenegro
-
 Morocco
-
 Mozambique
-
 Myanmar
-
 Namibia
-
 Nepal
-
 Netherlands
-
 New Zealand
-
 Nigeria
-
 North Macedonia
-
 Norway
-
 Oman
-
 Pakistan
-
 Palestine
-
 Panama
-
 Papua New Guinea
-
 Paraguay
-
 Peru
-
 Philippines
-
 Poland
-
 Portugal
-
 Puerto Rico
-
 Qatar
-
 Reunion
-
 Romania
-
 Rwanda
-
 Saudi Arabia
-
 Serbia
-
 Singapore
-
 Slovakia
-
 Slovenia
-
 Somalia
-
 South Africa
-
 Spain
-
 Sri Lanka
-
 Sweden
-
 Switzerland
-
 Syria
-
 Taiwan
-
 Tajikistan
-
 Tanzania
-
 Thailand
-
 Trinidad and Tobago
-
 Tunisia
-
 Turkey
-
 UAE
-
 Uganda
-
 Ukraine
-
 United Kingdom
-
United States
-
 Uruguay
-
 Uzbekistan
-
 Venezuela
-
 Vietnam
-
 Yemen
-
 Zambia
-
 Zimbabwe
- Forex
- Crypto












