

What's behind Shopify's latest 4.3% stock pullback?

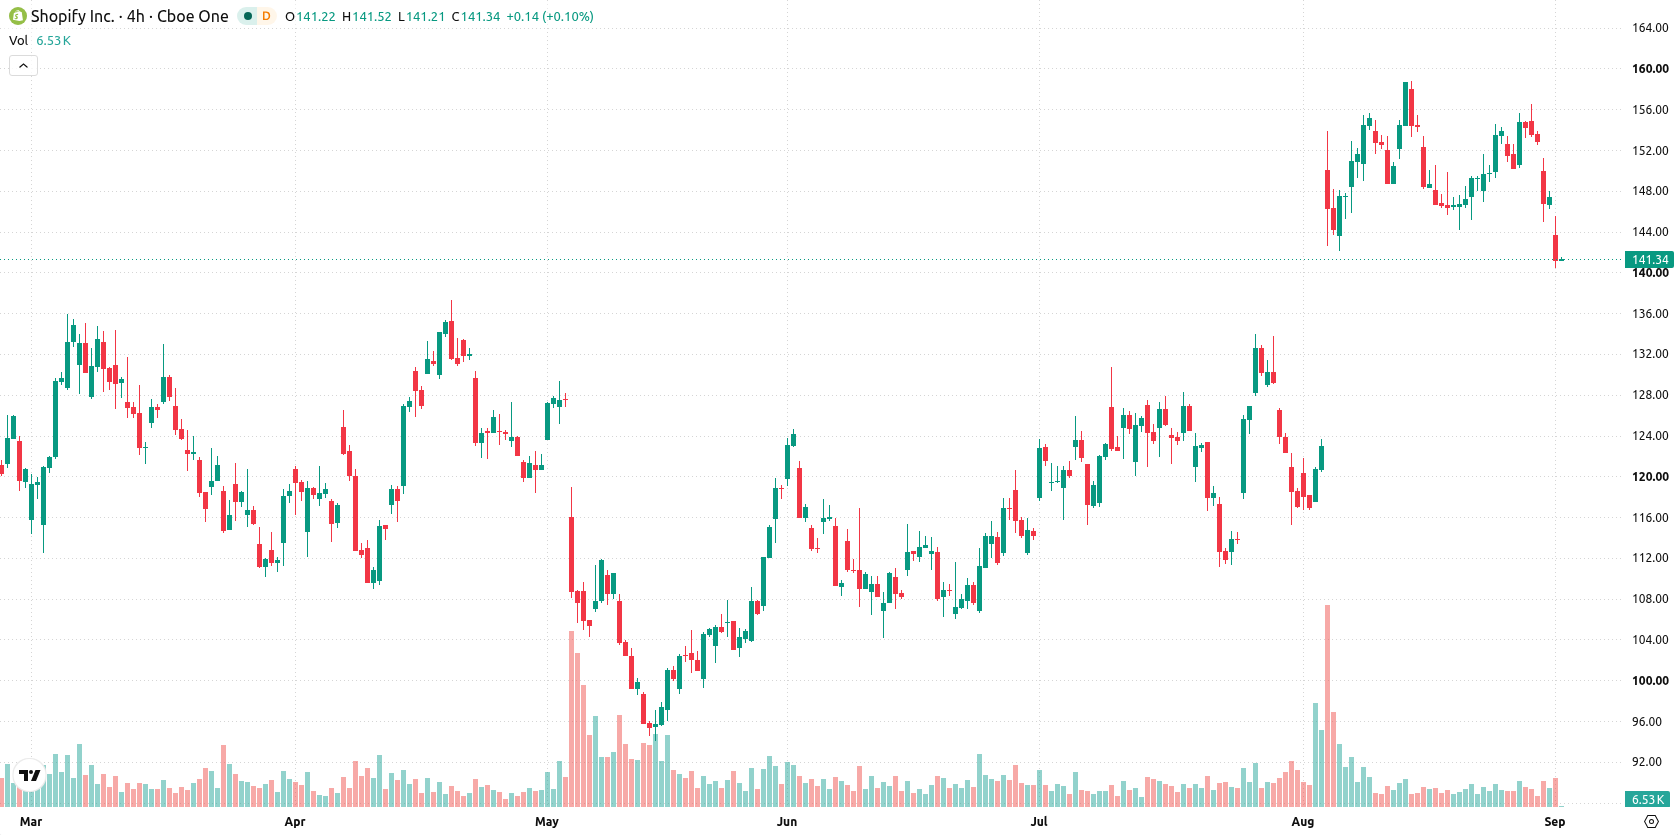
Shopify Inc. (SHOP) fell 4.33% on August 31, as institutional profit-taking and portfolio rebalancing triggered broad selling pressure. The downside is supported by Shopify closing below its 20-day moving average, although medium- and long-term moving averages continue to align bullishly.
 177.23
170.95
177.23
170.95
Highlights
- Shares of Shopify declined due to institutional profit-taking and portfolio rebalancing at the end of the month.
- The company reported strong quarterly earnings and raised guidance after an 18% gain in the prior month.
- Shopify stock trades near $140.99 with sustained short-term selling pressure, a projected five-day range of $135.63 to $146.36, and a 61% probability of rebounding.
Fresh profit-taking offsets strong guidance after prior rally
Shopify shares were impacted by month-end institutional profit-taking and portfolio rebalancing. The latest quarter saw strong earnings and raised company guidance. This came after an 18% rally in the previous month and reports of continued positive financial performance, though price action has remained under broader selling pressure.
Mixed momentum as intraday selling contrasts with bullish alignment
Shopify is trading below its 20-day moving average (MA-20) at $149.23, but remains above both the 50-day and 200-day moving averages at $131.53 and $131.38, respectively, highlighting ongoing bullish alignment for the medium and long term despite recent short-term selling pressure. The nearest resistance is the intraday low at $145.73, with support at $137.02 (Ichimoku Kijun). Momentum readings show the MACD at 6.65 and the Average Directional Index (ADX) at 23.77, both indicating underlying buying pressure. The Relative Strength Index (RSI) sits at 54.44, close to neutral, but the Stochastic RSI has dropped to 0, and Bull/Bear Power (BBP) is negative at -1.02, meaning sellers dominate intraday and indicate an oversold condition. The Commodity Channel Index (CCI) at -32.46 and the Awesome Oscillator (AO) reading support a neutral undertone, reinforcing mixed signals. The stock is trading at $140.99, down $6.39 or 4.33% with a clear downside opening gap of $1.41 (about 0.96%), hovering near the day’s low and daily volatility at 1.63%, suggesting sustained sell pressure and little recovery so far.
Earlier, analysts noted that Shopify was experiencing short-term sell pressure from institutional profit-taking, though overall trend signals remained broadly constructive. The current analysis reinforces this with new technical data indicating mixed momentum and heightened volatility, making sustained movement above $145.73 or below $137.02 key inflection points to watch for the next directional move.











-
 Afghanistan
-
 Albania
-
 Algeria
-
 Angola
-
 Argentina
-
 Armenia
-
 Australia
-
 Austria
-
 Azerbaijan
-
 Bahamas
-
 Bahrain
-
 Bangladesh
-
 Belarus
-
 Belgium
-
 Bolivia
-
 Botswana
-
 Brazil
-
 Brunei
-
 Bulgaria
-
 Cambodia
-
 Cameroon
-
 Canada
-
 Chile
Chile
-
 China
China
-
 Colombia
-
 Congo
Congo
-
 Costa Rica
-
 Cote d'Ivoire
-
 Croatia
-
 Cuba
Cuba
-
 Cyprus
-
 Czechia
-
 DR Congo
-
 Denmark
-
 Dominican Republic
-
 Ecuador
-
 Egypt
Egypt
-
 El Salvador
-
 Estonia
-
 Eswatini
-
 Ethiopia
-
 Finland
-
 France
-
 Georgia
-
 Germany
-
 Ghana
Ghana
-
 Greece
-
 Haiti
Haiti
-
 Hong Kong
-
 Hungary
-
 India
India
-
 Indonesia
-
 Iran, Islamic republic
-
 Iraq
Iraq
-
 Ireland
-
 Israel
-
 Italy
Italy
-
 Jamaica
-
 Japan
Japan
-
 Jordan
-
 Kazakhstan
-
 Kenya
Kenya
-
 Korea
Korea
-
 Kuwait
-
 Kyrgyzstan
-
 Laos
Laos
-
 Latvia
-
 Lebanon
-
 Lesotho
-
 Libya
Libya
-
 Lithuania
-
 Luxembourg
-
 Madagascar
-
 Malaysia
-
 Malta
Malta
-
 Mauritius
-
 Mexico
-
 Moldova
-
 Mongolia
-
 Montenegro
-
 Morocco
-
 Mozambique
-
 Myanmar
-
 Namibia
-
 Nepal
Nepal
-
 Netherlands
-
 New Zealand
-
 Nigeria
-
 North Macedonia
-
 Norway
-
 Oman
Oman
-
 Pakistan
-
 Palestine
-
 Panama
-
 Papua New Guinea
-
 Paraguay
-
 Peru
Peru
-
 Philippines
-
 Poland
-
 Portugal
-
 Puerto Rico
-
 Qatar
Qatar
-
 Reunion
-
 Romania
-
 Rwanda
-
 Saudi Arabia
-
 Serbia
-
 Singapore
-
 Slovakia
-
 Slovenia
-
 Somalia
-
 South Africa
-
 Spain
Spain
-
 Sri Lanka
-
 Sweden
-
 Switzerland
-
 Syria
Syria
-
 Taiwan
-
 Tajikistan
-
 Tanzania
-
 Thailand
-
 Trinidad and Tobago
-
 Tunisia
-
 Turkey
-
 UAE
UAE
-
 Uganda
-
 Ukraine
-
 United Kingdom
-
United States
-
 Uruguay
-
 Uzbekistan
-
 Venezuela
-
 Vietnam
-
 Yemen
Yemen
-
 Zambia
-
 Zimbabwe
- Forex
- Crypto












