

Shopify shares drop more than 4% after month-end institutional selling and technical pressure

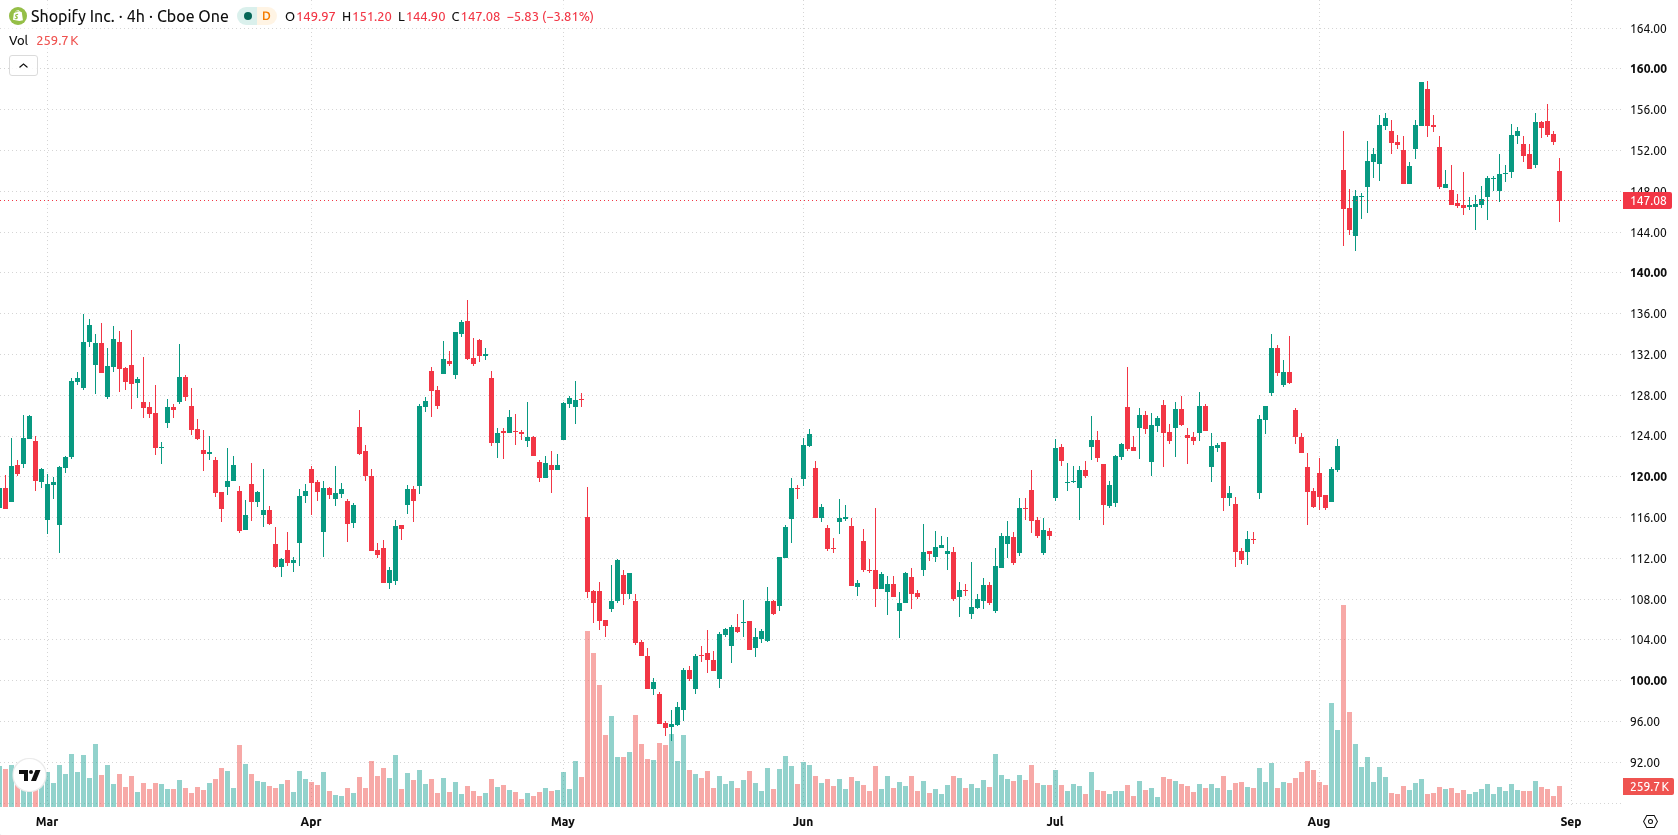
Shopify Inc. (SHOP) slid 4.10% as institutional profit-taking and month-end portfolio rebalancing drove today’s selling. The downside came even as technical structure shows the stock trading below its 20-day moving average, pointing to short-term pressure but with longer-term momentum still supporting the underlying trend.
 170.95
170.95
170.95
Highlights
- Shares of Shopify fell 4.1% intraday on August 31 due to institutional profit-taking and portfolio rebalancing.
- Shopify reported strong second-quarter earnings and raised forward guidance, with no major regulatory or product news disclosed.
- Shopify stock trades below its 20-day average but holds above longer-term supports, with indicators signaling bullish medium-term momentum and an expected trading range of $143.52 to $149.71 over five days.
Earnings strength offset by month-end rebalancing and subdued headlines
On August 31, Shopify shares experienced an intraday decline attributed to month-end institutional profit-taking and portfolio rebalancing. The company recently reported strong second-quarter earnings and raised its forward guidance. No major regulatory or product developments were mentioned, though price action has remained under broader selling pressure.
Short-term support holds as bullish momentum faces increased volatility
Shopify is trading below its 20-day moving average at $147.71, but remains well above both the 50-day ($130.76) and 200-day ($131.44) moving averages. This configuration highlights short-term seller pressure, while medium- and longer-term trend structure remains positive. The Ichimoku Kijun level at $135.12 serves as a key support. Immediate resistance stands at $147.71, with support at $143.52. Momentum remains broadly bullish: the MACD is firmly in the buy zone, and the ADX supports a continued upward trend. RSI reads 61.14 with a buy forecast, while the Stochastic RSI at 18.11 signals an oversold short-term condition. The CCI shows bullish momentum at 70.25. Bull/Bear Power is positive at 7.03, indicating buyers remain dominant, but BBP forecasts warn of overbought risk. The Awesome Oscillator also stays in buy territory. Price is near intraday lows and volatility is elevated at 2.62%, reflecting clear post-open pressure against ongoing bullish momentum on most daily indicators.
Earlier, analysts noted that Shopify faced near-term headwinds as institutional profit-taking and technical resistance contributed to short-term price weakness. The latest data supports a more constructive outlook, with bullish daily momentum now dominating and $149.71 emerging as the critical resistance level to monitor for renewed upside.











-
 Afghanistan
-
 Albania
-
 Algeria
-
 Angola
-
 Argentina
-
 Armenia
-
 Australia
-
 Austria
-
 Azerbaijan
-
 Bahamas
-
 Bahrain
-
 Bangladesh
-
 Belarus
-
 Belgium
-
 Bolivia
-
 Botswana
-
 Brazil
-
 Brunei
-
 Bulgaria
-
 Cambodia
-
 Cameroon
-
 Canada
-
 Chile
Chile
-
 China
China
-
 Colombia
-
 Congo
Congo
-
 Costa Rica
-
 Cote d'Ivoire
-
 Croatia
-
 Cuba
Cuba
-
 Cyprus
-
 Czechia
-
 DR Congo
-
 Denmark
-
 Dominican Republic
-
 Ecuador
-
 Egypt
Egypt
-
 El Salvador
-
 Estonia
-
 Eswatini
-
 Ethiopia
-
 Finland
-
 France
-
 Georgia
-
 Germany
-
 Ghana
Ghana
-
 Greece
-
 Haiti
Haiti
-
 Hong Kong
-
 Hungary
-
 India
India
-
 Indonesia
-
 Iran, Islamic republic
-
 Iraq
Iraq
-
 Ireland
-
 Israel
-
 Italy
Italy
-
 Jamaica
-
 Japan
Japan
-
 Jordan
-
 Kazakhstan
-
 Kenya
Kenya
-
 Korea
Korea
-
 Kuwait
-
 Kyrgyzstan
-
 Laos
Laos
-
 Latvia
-
 Lebanon
-
 Lesotho
-
 Libya
Libya
-
 Lithuania
-
 Luxembourg
-
 Madagascar
-
 Malaysia
-
 Malta
Malta
-
 Mauritius
-
 Mexico
-
 Moldova
-
 Mongolia
-
 Montenegro
-
 Morocco
-
 Mozambique
-
 Myanmar
-
 Namibia
-
 Nepal
Nepal
-
 Netherlands
-
 New Zealand
-
 Nigeria
-
 North Macedonia
-
 Norway
-
 Oman
Oman
-
 Pakistan
-
 Palestine
-
 Panama
-
 Papua New Guinea
-
 Paraguay
-
 Peru
Peru
-
 Philippines
-
 Poland
-
 Portugal
-
 Puerto Rico
-
 Qatar
Qatar
-
 Reunion
-
 Romania
-
 Rwanda
-
 Saudi Arabia
-
 Serbia
-
 Singapore
-
 Slovakia
-
 Slovenia
-
 Somalia
-
 South Africa
-
 Spain
Spain
-
 Sri Lanka
-
 Sweden
-
 Switzerland
-
 Syria
Syria
-
 Taiwan
-
 Tajikistan
-
 Tanzania
-
 Thailand
-
 Trinidad and Tobago
-
 Tunisia
-
 Turkey
-
 UAE
UAE
-
 Uganda
-
 Ukraine
-
 United Kingdom
-
United States
-
 Uruguay
-
 Uzbekistan
-
 Venezuela
-
 Vietnam
-
 Yemen
Yemen
-
 Zambia
-
 Zimbabwe
- Forex
- Crypto












