

Shopify shares technical analysis: Upward price move signals strong buyer support

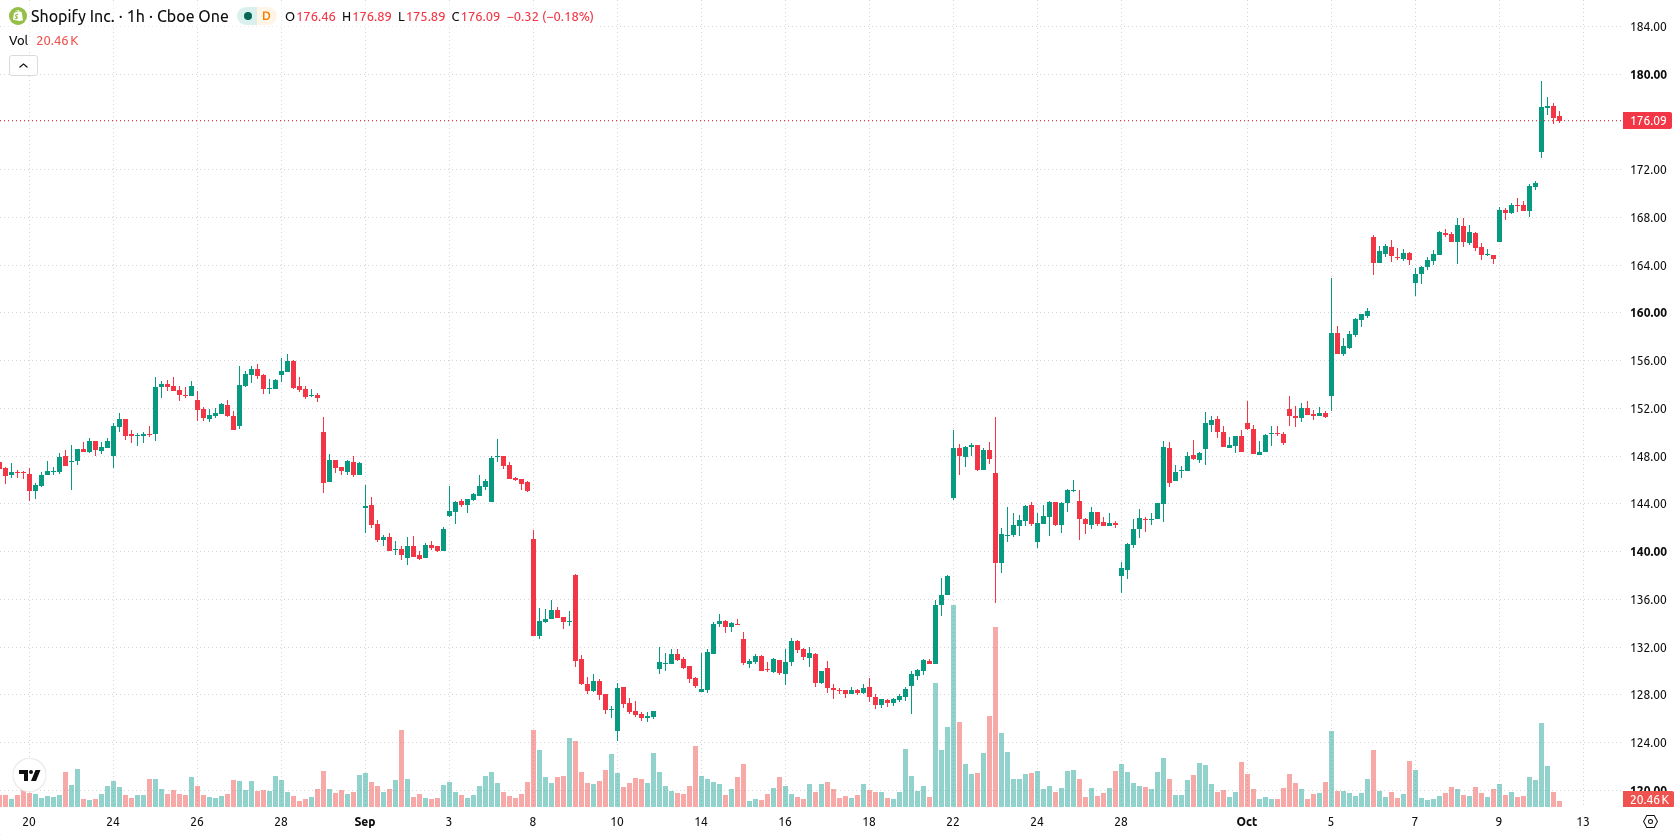
Shopify Inc. (SHOP) stock is trading at $176.09, marking an increase of 3.08% on the day. The price currently sits above its key moving averages, reflecting strong momentum in both intraday and wider timeframes.
 180.86
180.86
180.86
Highlights
- Shopify has incorporated artificial intelligence to handle increased agentic commerce transactions and support larger order values for merchants.
- Merchant migrations to Shopify's platform have accelerated, raising product relevance and the potential for transaction-driven revenue growth.
- Shares of Shopify trade in a strong bullish trend despite overbought indicator readings, with a projected price range of $171.98 to $180.2 in the next few days.
Merchant migrations rise as AI integration boosts transaction value
Shopify has advanced its transactional capabilities with the integration of artificial intelligence, a move that has enabled the company to process an increasing volume of agentic commerce transactions and deliver larger order values, according to Investing.com and TradingKey. This operational upgrade directly enhances Shopify's value proposition to merchants by offering differentiated technology and greater platform utility, which in turn increases the potential for transaction-driven revenue. The resulting surge in merchant migrations and engagement suggests growing product relevance, aligning with the strong demand currently seen for SHOP shares.
Momentum persists as technical indicators diverge on overbought signals
On the h1 chart, SHOP is positioned above the MA-20 at $166.86 and MA-50 at $160.36, signaling persistent bullish momentum in the short- and medium-term, and remains well above the MA-200 at $129.52. Immediate daily support is provided by the Ichimoku Kijun at $166.15. Among technical indicators, MACD and ADX continue to exhibit strong bullish signals. However, RSI registers at 72.92, alongside overbought readings on Stochastic RSI, CCI, and Bull/Bear Power, all pointing to stretched upside conditions and ongoing buyer dominance. The Awesome Oscillator is currently neutral, providing limited confirmation to the trend. Together, these factors highlight a divergence between robust momentum and an overheated technical profile.
Upside continuation favored amid low pullback probability
Over the next several trading days, SHOP is forecast to trade within a typical volatility range between $171.98 and $180.2, with a 79% probability of continuation to the upside and a 21% probability of a reversal lower. The most likely scenario is continued consolidation in this band, while a breakout above $180.2 would confirm further bullish momentum. Should the price retreat below immediate support, a corrective pullback may develop, though the probability for such a move remains limited in the short term.
Earlier, analysts noted that Shopify's strong operational performance and persistent technical momentum underscored a robust upward trend for the stock. The current setup reinforces this view with sustained bullish signals, but traders should closely monitor the $180.2 resistance level as a decisive breakout point for further gains.





Latest Shopify News






-
 Afghanistan
-
 Albania
-
 Algeria
-
 Angola
-
 Argentina
-
 Armenia
-
 Australia
-
 Austria
-
 Azerbaijan
-
 Bahamas
-
 Bahrain
-
 Bangladesh
-
 Belarus
-
 Belgium
-
 Bolivia
-
 Botswana
-
 Brazil
-
 Brunei
-
 Bulgaria
-
 Cambodia
-
 Cameroon
-
 Canada
-
 Chile
Chile
-
 China
China
-
 Colombia
-
 Congo
Congo
-
 Costa Rica
-
 Cote d'Ivoire
-
 Croatia
-
 Cuba
Cuba
-
 Cyprus
-
 Czechia
-
 DR Congo
-
 Denmark
-
 Dominican Republic
-
 Ecuador
-
 Egypt
Egypt
-
 El Salvador
-
 Estonia
-
 Eswatini
-
 Ethiopia
-
 Finland
-
 France
-
 Georgia
-
 Germany
-
 Ghana
Ghana
-
 Greece
-
 Haiti
Haiti
-
 Hong Kong
-
 Hungary
-
 India
India
-
 Indonesia
-
 Iran, Islamic republic
-
 Iraq
Iraq
-
 Ireland
-
 Israel
-
 Italy
Italy
-
 Jamaica
-
 Japan
Japan
-
 Jordan
-
 Kazakhstan
-
 Kenya
Kenya
-
 Korea
Korea
-
 Kuwait
-
 Kyrgyzstan
-
 Laos
Laos
-
 Latvia
-
 Lebanon
-
 Lesotho
-
 Libya
Libya
-
 Lithuania
-
 Luxembourg
-
 Madagascar
-
 Malaysia
-
 Malta
Malta
-
 Mauritius
-
 Mexico
-
 Moldova
-
 Mongolia
-
 Montenegro
-
 Morocco
-
 Mozambique
-
 Myanmar
-
 Namibia
-
 Nepal
Nepal
-
 Netherlands
-
 New Zealand
-
 Nigeria
-
 North Macedonia
-
 Norway
-
 Oman
Oman
-
 Pakistan
-
 Palestine
-
 Panama
-
 Papua New Guinea
-
 Paraguay
-
 Peru
Peru
-
 Philippines
-
 Poland
-
 Portugal
-
 Puerto Rico
-
 Qatar
Qatar
-
 Reunion
-
 Romania
-
 Rwanda
-
 Saudi Arabia
-
 Serbia
-
 Singapore
-
 Slovakia
-
 Slovenia
-
 Somalia
-
 South Africa
-
 Spain
Spain
-
 Sri Lanka
-
 Sweden
-
 Switzerland
-
 Syria
Syria
-
 Taiwan
-
 Tajikistan
-
 Tanzania
-
 Thailand
-
 Trinidad and Tobago
-
 Tunisia
-
 Turkey
-
 UAE
UAE
-
 Uganda
-
 Ukraine
-
 United Kingdom
-
United States
-
 Uruguay
-
 Uzbekistan
-
 Venezuela
-
 Vietnam
-
 Yemen
Yemen
-
 Zambia
-
 Zimbabwe
- Forex
- Crypto












