

Dutch Bros stock support test: Key levels to watch

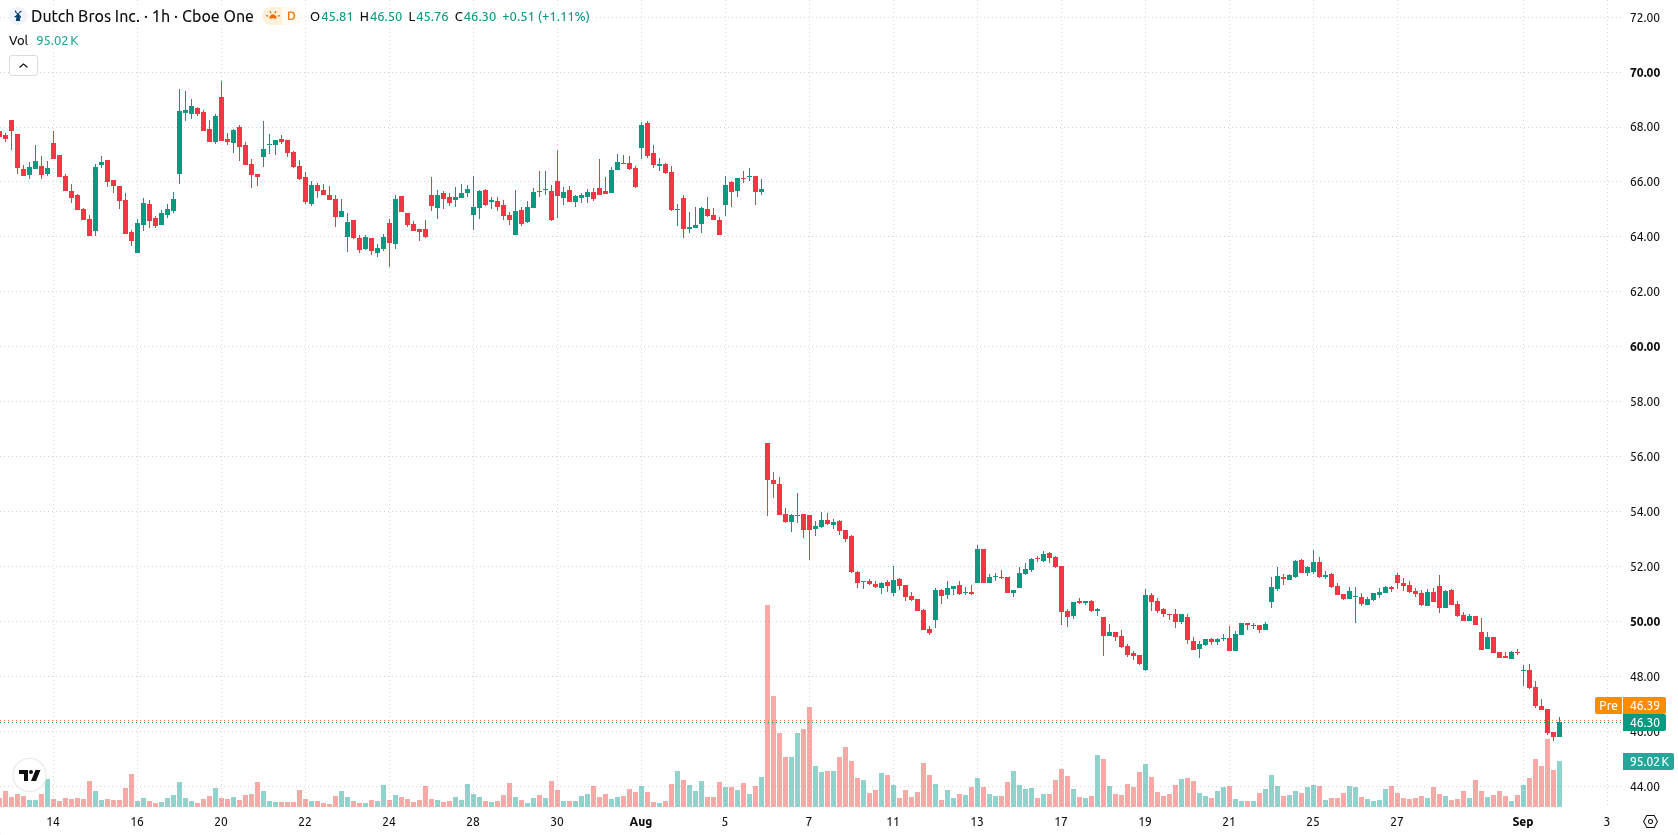
Dutch Bros (BROS) stock is trading at $46.31 after slipping 5.22% today, finishing near its low in a session marked by high volatility. The price is currently below its key moving averages, placing it under pressure across short-, medium-, and long-term timeframes.
 42.62
42.62
Highlights
- Dutch Bros reported 32.5% revenue growth in Q2 and increased its full-year guidance, signaling strong recent operating performance.
- The company announced the acquisition of 65 Salad and Go locations in four states, expanding its footprint in key regions.
- Shares of Dutch Bros fell 5.22% to $46.31 with technical indicators confirming downside momentum and a likely trading range of $43.57 to $49.05 in the next 2 to 3 days.
Sentiment pressured as guidance sours enthusiasm for expansion and growth
Dutch Bros beat its Q2 earnings estimates with 32.5% revenue growth and raised its full-year guidance, reflecting stronger-than-expected operating performance according to MarketBeat. However, the company also issued softer Q3 same-store sales guidance, which may have led investors to moderate their forward expectations. Additionally, Dutch Bros has released a statement on its previously announced acquisition of 65 Salad and Go locations across Arizona, Nevada, Oklahoma, and Texas, a move that will expand its presence in key markets. Despite the positive signals from past financial results and strategic expansion, sentiment has been pressured by nearer-term outlook concerns.
Downside momentum persists as technical indicators diverge sharply
Technically, BROS is trading below the MA-20 at $48.6, MA-50 at $50.16, and MA-200 at $57.29, pointing to downside trends on multiple timeframes. Immediate resistance is marked by the Ichimoku Kijun at $48.64, acting as the level to watch for any attempted rebound. Momentum indicators including MACD, ADX, and the Awesome Oscillator all signal continued downside risk. The RSI is extremely low at 25.7, while CCI and Bull/Bear Power are also deep in oversold or strong sell territory. In contrast, Stoch RSI flashes a strong buy, creating a notable divergence among oscillators and suggesting short-term volatility remains elevated.
Bearish bias dominates as breakout odds favor further downside
Over the next 2–3 trading days, BROS is expected to consolidate within a range of $43.57 to $49.05. The likelihood of a further move lower is estimated at 75%, while the probability of an upside breakout is just 25%. A sustained bullish reversal would require a clear advance above $49.05, while a loss of support at $43.57 would open the door to additional downside within the prevailing volatility band.
Earlier, analysts noted that Dutch Bros was under sustained technical pressure, with downside momentum and bearish signals dominating the trend outlook. The current trading setup continues to underscore heightened risk, with a close watch warranted on the $43.57 floor, as a decisive break below this level could trigger another leg lower within the near-term volatility band.









-
 Afghanistan
-
 Albania
-
 Algeria
-
 Angola
-
 Argentina
-
 Armenia
-
 Australia
-
 Austria
-
 Azerbaijan
-
 Bahamas
-
 Bahrain
-
 Bangladesh
-
 Belarus
-
 Belgium
-
 Bolivia
-
 Botswana
-
 Brazil
-
 Brunei
-
 Bulgaria
-
 Cambodia
-
 Cameroon
-
 Canada
-
 Chile
-
 China
-
 Colombia
-
 Congo
-
 Costa Rica
-
 Cote d'Ivoire
-
 Croatia
-
 Cuba
-
 Cyprus
-
 Czechia
-
 DR Congo
-
 Denmark
-
 Dominican Republic
-
 Ecuador
-
 Egypt
-
 El Salvador
-
 Estonia
-
 Eswatini
-
 Ethiopia
-
 Finland
-
 France
-
 Georgia
-
 Germany
-
 Ghana
-
 Greece
-
 Haiti
-
 Hong Kong
-
 Hungary
-
 India
-
 Indonesia
-
 Iran, Islamic republic
-
 Iraq
-
 Ireland
-
 Israel
-
 Italy
-
 Jamaica
-
 Japan
-
 Jordan
-
 Kazakhstan
-
 Kenya
-
 Korea
-
 Kuwait
-
 Kyrgyzstan
-
 Laos
-
 Latvia
-
 Lebanon
-
 Lesotho
-
 Libya
-
 Lithuania
-
 Luxembourg
-
 Madagascar
-
 Malaysia
-
 Malta
-
 Mauritius
-
 Mexico
-
 Moldova
-
 Mongolia
-
 Montenegro
-
 Morocco
-
 Mozambique
-
 Myanmar
-
 Namibia
-
 Nepal
-
 Netherlands
-
 New Zealand
-
 Nigeria
-
 North Macedonia
-
 Norway
-
 Oman
-
 Pakistan
-
 Palestine
-
 Panama
-
 Papua New Guinea
-
 Paraguay
-
 Peru
-
 Philippines
-
 Poland
-
 Portugal
-
 Puerto Rico
-
 Qatar
-
 Reunion
-
 Romania
-
 Rwanda
-
 Saudi Arabia
-
 Serbia
-
 Singapore
-
 Slovakia
-
 Slovenia
-
 Somalia
-
 South Africa
-
 Spain
-
 Sri Lanka
-
 Sweden
-
 Switzerland
-
 Syria
-
 Taiwan
-
 Tajikistan
-
 Tanzania
-
 Thailand
-
 Trinidad and Tobago
-
 Tunisia
-
 Turkey
-
 UAE
-
 Uganda
-
 Ukraine
-
 United Kingdom
-
United States
-
 Uruguay
-
 Uzbekistan
-
 Venezuela
-
 Vietnam
-
 Yemen
-
 Zambia
-
 Zimbabwe
- Forex
- Crypto












