

GPN rises as short-term gains remain capped by $93.94 resistance

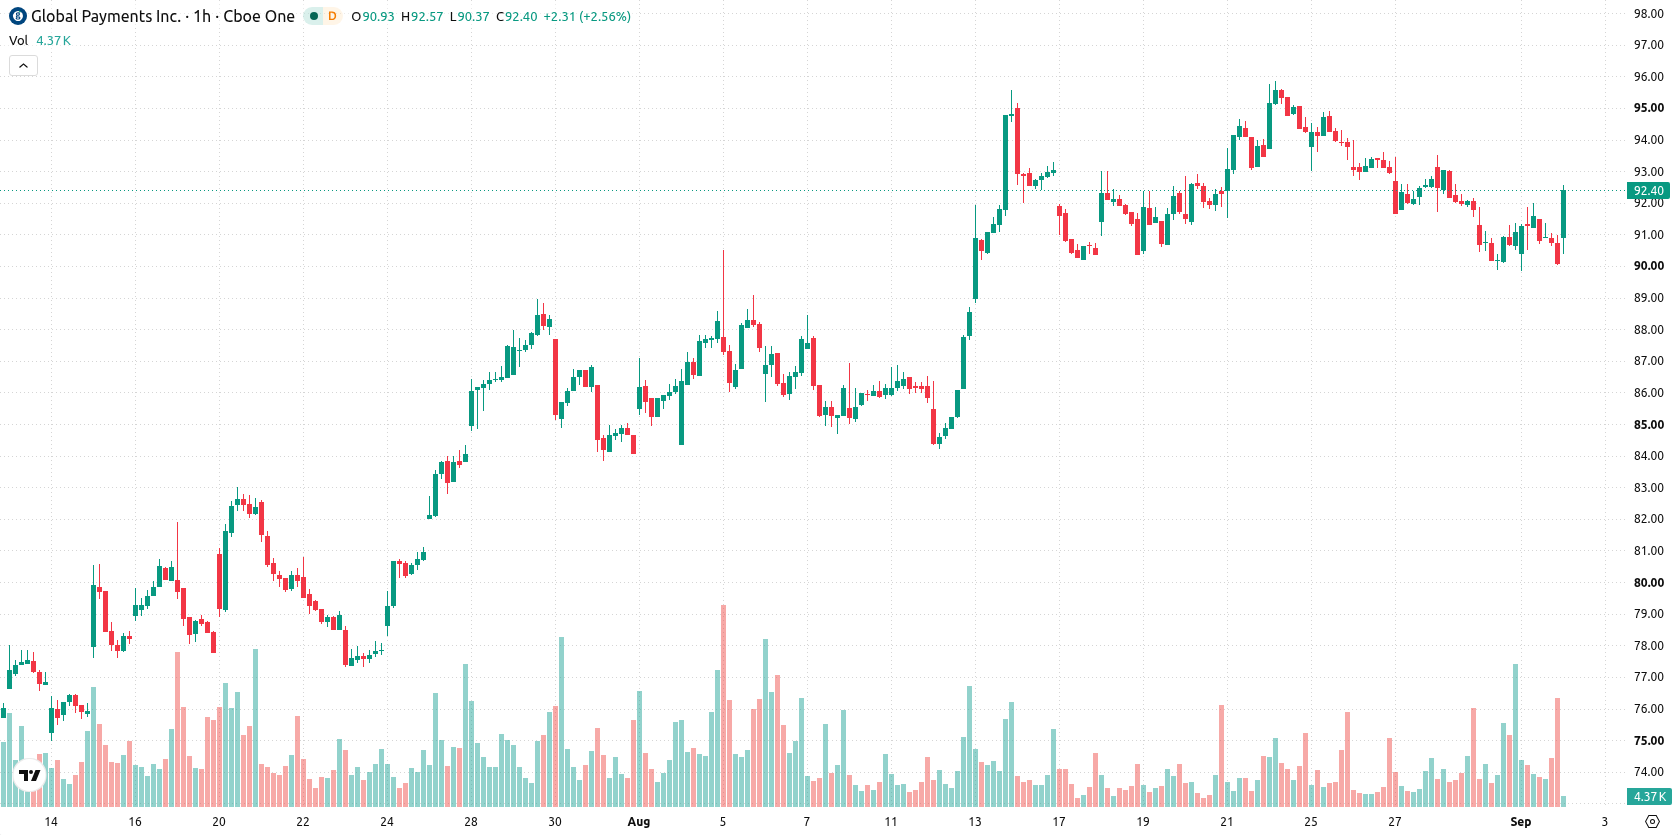
Global Payments (GPN) stock is trading at $92.18, up 2.35% for the day. The price sits above its key short-term moving average but remains capped by medium-term levels.
 99.92
100.75
Highlights
- GPN/USD trades up 2.35% on the day, currently priced at $92.18 with moderate intraday volatility.
- Technical setup signals a short-term bullish bias but medium-term downside risk, with mixed and mostly bearish momentum indicators.
- For the next 2 to 3 sessions, range is expected between $89.6 and $93.94, with high probability of a stronger downward move.
Mixed momentum signals with downside risks as technical barriers persist
On the hourly chart, GPN trades above the MA-20 ($91.18) but remains below the MA-50 ($92.63), while sitting well above the longer-term MA-200 ($75.39, daily). The Ichimoku Kijun level at $91.7 acts as immediate support. Momentum signals are mixed: MACD registers a strong sell, ADX is neutral, RSI and CCI both indicate oversold conditions and bias to sell, while Stoch RSI and Awesome Oscillator remain neutral; Bull/Bear Power signals oversold with seller dominance. Short-term price action shows an intraday positive gap of 0.27 near daily highs and moderate volatility, but downside indicator divergence raises potential reversal risk.
Downside favored as breakout odds remain limited in near term
Over the next 2–3 trading days, GPN is expected to fluctuate between $89.6 and $93.94, representing a typical volatility band relative to current levels. The probability of an upward breakout is very low, while a stronger down move is much more likely. The base case scenario is for the price to move sideways within this defined range, with an upside move requiring a decisive break above $93.94, while a close below $89.6 would confirm renewed downside momentum.
Earlier, analysts noted that persistent competition and strategic shifts remain a key focus for leading digital payments providers. With Global Payments now trading above its short-term average but facing technical resistance, the prevailing scenario points to a possible sideways movement, making the $93.94 level a critical threshold for gauging any near-term breakout risk.






Latest Global Payments News





-
 Afghanistan
-
 Albania
-
 Algeria
-
 Angola
-
 Argentina
-
 Armenia
-
 Australia
-
 Austria
-
 Azerbaijan
-
 Bahamas
-
 Bahrain
-
 Bangladesh
-
 Belarus
-
 Belgium
-
 Bolivia
-
 Botswana
-
 Brazil
-
 Brunei
-
 Bulgaria
-
 Cambodia
-
 Cameroon
-
 Canada
-
 Chile
-
 China
-
 Colombia
-
 Congo
-
 Costa Rica
-
 Cote d'Ivoire
-
 Croatia
-
 Cuba
-
 Cyprus
-
 Czechia
-
 DR Congo
-
 Denmark
-
 Dominican Republic
-
 Ecuador
-
 Egypt
-
 El Salvador
-
 Estonia
-
 Eswatini
-
 Ethiopia
-
 Finland
-
 France
-
 Georgia
-
 Germany
-
 Ghana
-
 Greece
-
 Haiti
-
 Hong Kong
-
 Hungary
-
 India
-
 Indonesia
-
 Iran, Islamic republic
-
 Iraq
-
 Ireland
-
 Israel
-
 Italy
-
 Jamaica
-
 Japan
-
 Jordan
-
 Kazakhstan
-
 Kenya
-
 Korea
-
 Kuwait
-
 Kyrgyzstan
-
 Laos
-
 Latvia
-
 Lebanon
-
 Lesotho
-
 Libya
-
 Lithuania
-
 Luxembourg
-
 Madagascar
-
 Malaysia
-
 Malta
-
 Mauritius
-
 Mexico
-
 Moldova
-
 Mongolia
-
 Montenegro
-
 Morocco
-
 Mozambique
-
 Myanmar
-
 Namibia
-
 Nepal
-
 Netherlands
-
 New Zealand
-
 Nigeria
-
 North Macedonia
-
 Norway
-
 Oman
-
 Pakistan
-
 Palestine
-
 Panama
-
 Papua New Guinea
-
 Paraguay
-
 Peru
-
 Philippines
-
 Poland
-
 Portugal
-
 Puerto Rico
-
 Qatar
-
 Reunion
-
 Romania
-
 Rwanda
-
 Saudi Arabia
-
 Serbia
-
 Singapore
-
 Slovakia
-
 Slovenia
-
 Somalia
-
 South Africa
-
 Spain
-
 Sri Lanka
-
 Sweden
-
 Switzerland
-
 Syria
-
 Taiwan
-
 Tajikistan
-
 Tanzania
-
 Thailand
-
 Trinidad and Tobago
-
 Tunisia
-
 Turkey
-
 UAE
-
 Uganda
-
 Ukraine
-
 United Kingdom
-
United States
-
 Uruguay
-
 Uzbekistan
-
 Venezuela
-
 Vietnam
-
 Yemen
-
 Zambia
-
 Zimbabwe
- Forex
- Crypto












