

Procter & Gamble stock recovery holds but faces a stretched setup: weekly analysis

Shares of The Procter & Gamble Company (PG) are trading near $146.50 after rising a little more than 2% over the past week, as the recovery continues but signals look stretched. The daily chart reflects mixed momentum, with elevated but conflicting signals calling attention to the risk of pullback or consolidation as the setup for the week ahead.
 163.57
161.21
Highlights
- Shares of Procter & Gamble rose $2.86 in the past week to $146.51, trading near key resistance.
- The stock trades above its short-term moving average but remains below longer-term averages, suggesting a bearish long-term trend.
- The expected range for the next five trading days is $141.04 to $149.46, with signals indicating overbought conditions and potential for consolidation or a pullback.
Strength in core earnings and dividends fuels positive sentiment this week
Procter & Gamble reported fiscal year 2026 results with core earnings per share of $6.89, highlighting ongoing strong cash generation and returning over $15 billion to shareholders through dividends and buybacks, according to coverage by Ad Hoc News. The company extended its record to 70 consecutive years of annual dividend increases, reinforcing management’s commitment to capital returns for the upcoming fiscal years. Continued focus on resilient household and personal care brands helps anchor sentiment for PG in the week ahead.
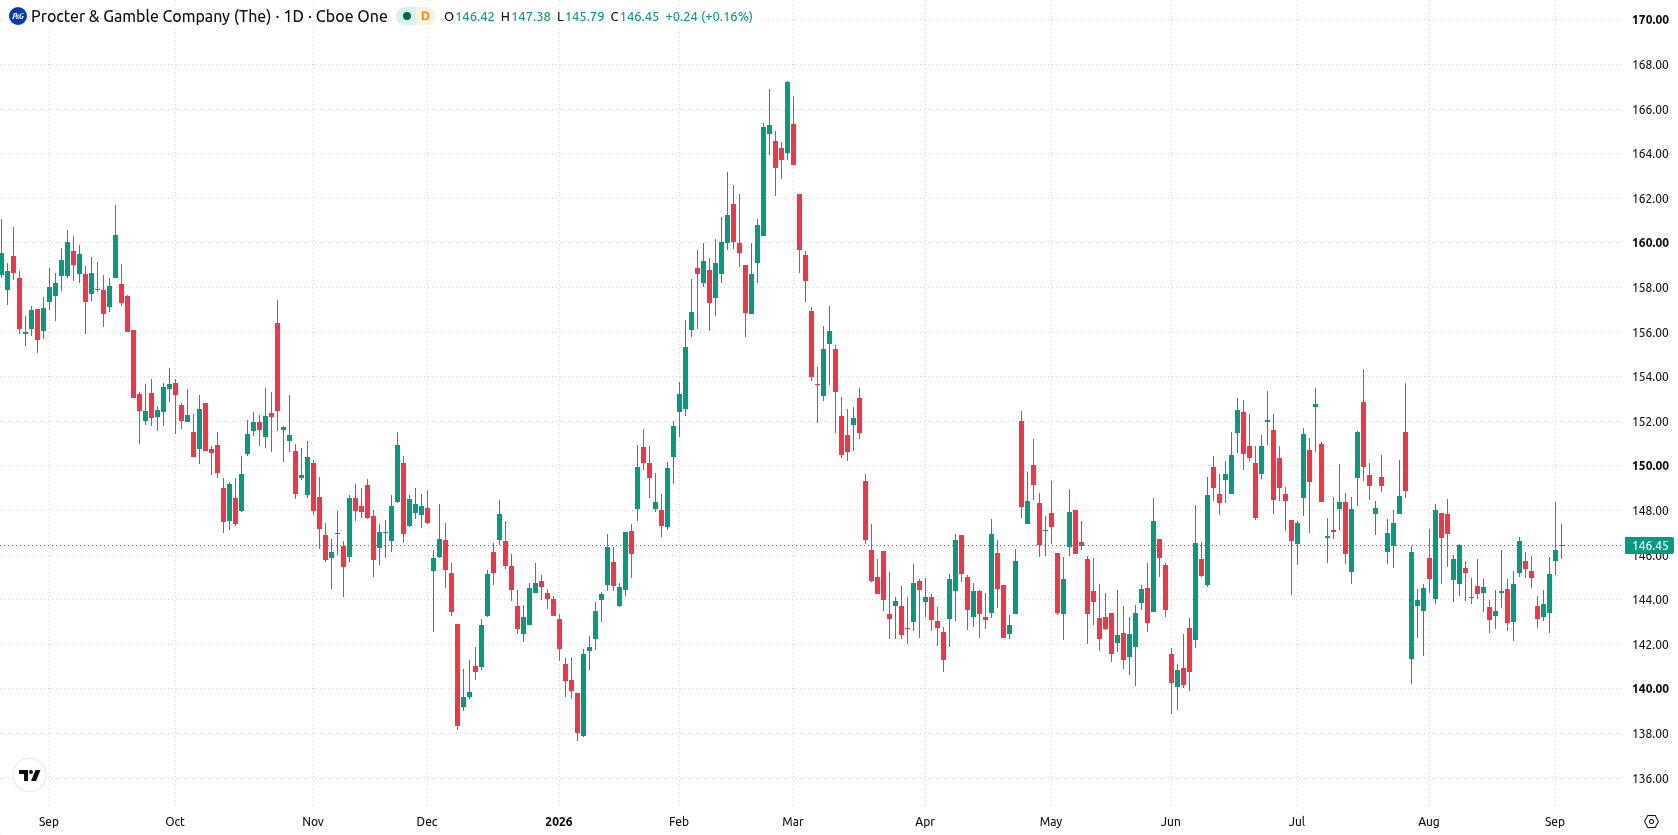
Mixed technical momentum signals short-term overbought risk this week
The daily chart shows a contained move within a narrow range, with volatility over the past week at 3.89%. Momentum signals are mixed: CCI at 132.09 and Stochastic RSI at 93.28 both indicate overbought conditions, while MACD points to continued downside pressure. Immediate support lies at $144.89 and resistance remains at $146.92, which is reinforced by the Ichimoku Kijun level at $146.94. Taken together, this setup hints at potential consolidation or a pullback in the short term.
Neutral weekly bias as range trading anchors breakout scenarios ahead
For the next five trading days, the expected range is $141.04 to $149.46, with a 50% probability each for an increase or decrease. The base case calls for the stock to drift within this range, anchored by the support at $144.89 and resistance near $146.92. A sustained break above resistance could open up a move toward $149.46, while closing below support would leave the stock exposed to further downside toward $141.04.
Earlier, analysts noted that Procter & Gamble was navigating a period of consolidation with mixed technical indicators and a cautious trading outlook. With the latest earnings and elevated momentum readings, traders should closely monitor the $146.92-$149.46 area as a pivotal zone for potential breakout or renewed consolidation in the days ahead.






Latest Procter & Gamble News





-
 Afghanistan
-
 Albania
-
 Algeria
-
 Angola
-
 Argentina
-
 Armenia
-
 Australia
-
 Austria
-
 Azerbaijan
-
 Bahamas
-
 Bahrain
-
 Bangladesh
-
 Belarus
-
 Belgium
-
 Bolivia
-
 Botswana
-
 Brazil
-
 Brunei
-
 Bulgaria
-
 Cambodia
-
 Cameroon
-
 Canada
-
 Chile
-
 China
-
 Colombia
-
 Congo
-
 Costa Rica
-
 Cote d'Ivoire
-
 Croatia
-
 Cuba
-
 Cyprus
-
 Czechia
-
 DR Congo
-
 Denmark
-
 Dominican Republic
-
 Ecuador
-
 Egypt
-
 El Salvador
-
 Estonia
-
 Eswatini
-
 Ethiopia
-
 Finland
-
 France
-
 Georgia
-
 Germany
-
 Ghana
-
 Greece
-
 Haiti
-
 Hong Kong
-
 Hungary
-
 India
-
 Indonesia
-
 Iran, Islamic republic
-
 Iraq
-
 Ireland
-
 Israel
-
 Italy
-
 Jamaica
-
 Japan
-
 Jordan
-
 Kazakhstan
-
 Kenya
-
 Korea
-
 Kuwait
-
 Kyrgyzstan
-
 Laos
-
 Latvia
-
 Lebanon
-
 Lesotho
-
 Libya
-
 Lithuania
-
 Luxembourg
-
 Madagascar
-
 Malaysia
-
 Malta
-
 Mauritius
-
 Mexico
-
 Moldova
-
 Mongolia
-
 Montenegro
-
 Morocco
-
 Mozambique
-
 Myanmar
-
 Namibia
-
 Nepal
-
 Netherlands
-
 New Zealand
-
 Nigeria
-
 North Macedonia
-
 Norway
-
 Oman
-
 Pakistan
-
 Palestine
-
 Panama
-
 Papua New Guinea
-
 Paraguay
-
 Peru
-
 Philippines
-
 Poland
-
 Portugal
-
 Puerto Rico
-
 Qatar
-
 Reunion
-
 Romania
-
 Rwanda
-
 Saudi Arabia
-
 Serbia
-
 Singapore
-
 Slovakia
-
 Slovenia
-
 Somalia
-
 South Africa
-
 Spain
-
 Sri Lanka
-
 Sweden
-
 Switzerland
-
 Syria
-
 Taiwan
-
 Tajikistan
-
 Tanzania
-
 Thailand
-
 Trinidad and Tobago
-
 Tunisia
-
 Turkey
-
 UAE
-
 Uganda
-
 Ukraine
-
 United Kingdom
-
United States
-
 Uruguay
-
 Uzbekistan
-
 Venezuela
-
 Vietnam
-
 Yemen
-
 Zambia
-
 Zimbabwe
- Forex
- Crypto












