


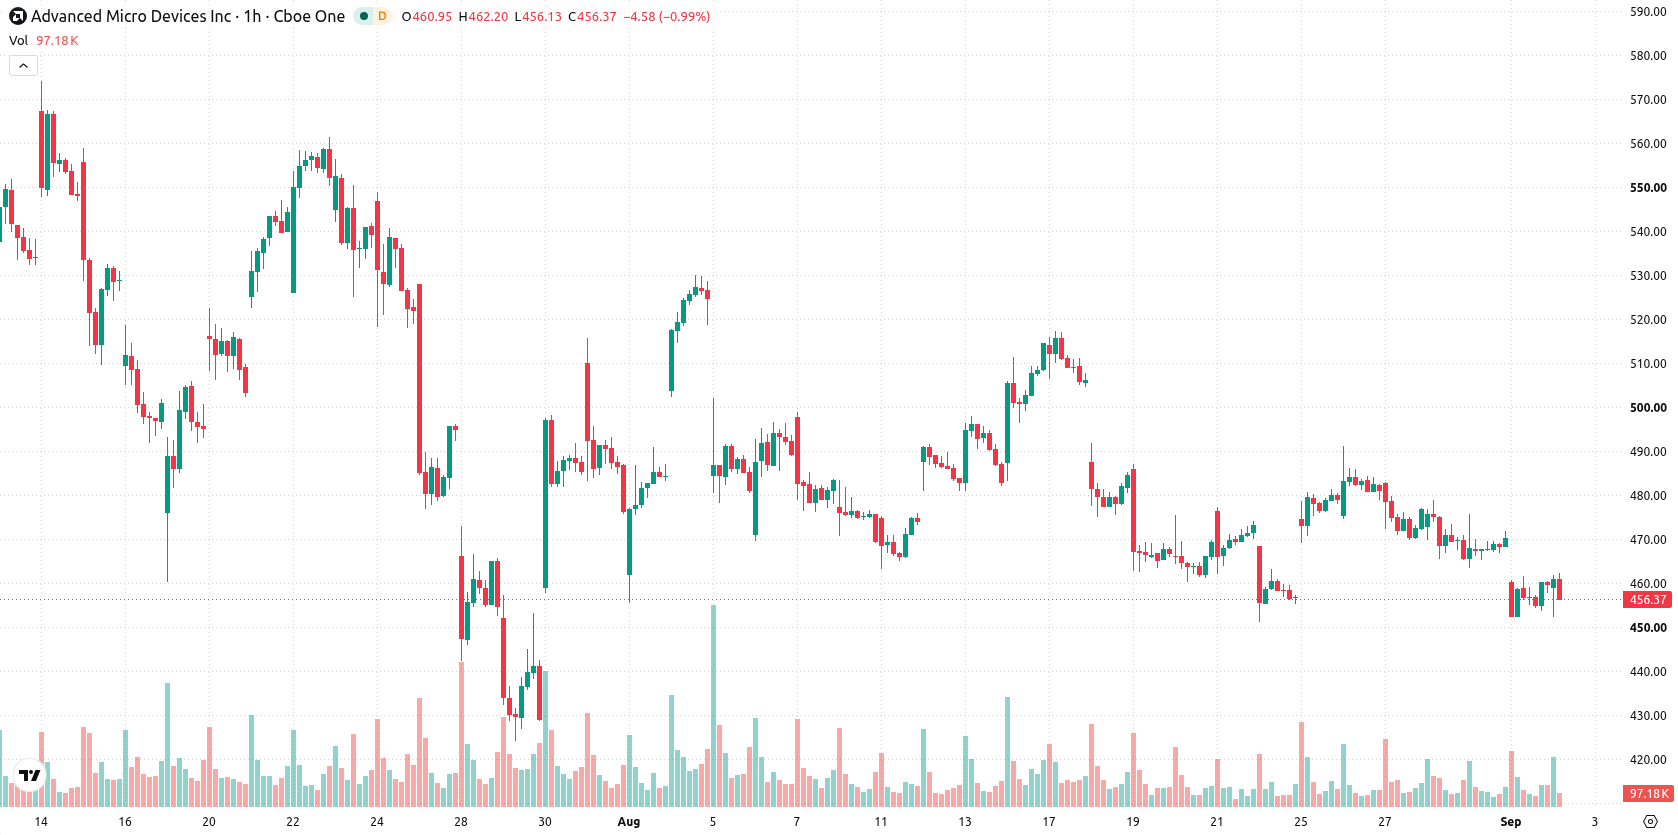
Advanced Micro Devices, Inc. (AMD) stock is trading at $460.56 after a modest gain on the session. The price remains below its short- and medium-term moving averages, with overall positioning defined by recent seller activity.
 519.58
578.75
Highlights
- Advanced Micro Devices reported Q2 revenue growth of 50.1% year over year to $11.54 billion and non-GAAP operating income up 245%.
- The data center segment contributed significantly to improved profitability, supporting AMD's strategy against market competition.
- AMD stock trades below short- and medium-term moving averages with weak momentum signals and is expected to range between $447.86 to $473.26 in the next 2 to 3 days, with a high probability for a downward move.
Profit surges as data center demand strengthens earnings momentum
Advanced Micro Devices reported Q2 revenue growth of 50.1% year-over-year to $11.54 billion, accompanied by a 245% increase in non-GAAP operating income, according to Seekingalpha. These results highlight broad-based strength in high-value segments, with especially strong demand driving a 50% jump in revenue and 82% growth in EPS. The data center segment played a key role in accelerating profitability, offering validation for AMD's expansion strategy amid ongoing market competition.
Resistance overrides as oversold signals challenge recent gains
On the hourly chart, the price is trading below the MA-20 at $464.93 and the MA-50 at $469.96, confirming short-term and medium-term hurdles. Immediate resistance is defined by the Ichimoku Kijun at $465.53, while the daily chart places AMD well above the MA-200 at $337.69, providing structural support for the longer-term trend. Key momentum indicators point to weakness: RSI is at 41.77 (Sell), MACD and CCI are both in Sell territory, and Bull/Bear Power indicates an oversold condition intraday. ADX, Stochastic RSI, and the Awesome Oscillator remain neutral, while divergence between oversold oscillator readings and lackluster momentum suggests that current price gains are yet to be confirmed by improving sentiment.
Range-bound trade likely as downside risk limits rally prospects
Over the next 2 to 3 trading days, AMD is expected to fluctuate within a range of $447.86 to $473.26, consistent with typical volatility near current levels. The probability of a continued rally is low, while downside risk dominates the short-term outlook. If AMD breaks above resistance at $465.53, upward momentum could emerge; conversely, a move below $447.86 would likely trigger further declines. The most likely scenario is continued oscillation within the identified corridor as the market awaits new catalysts.
Previously it was reported that strong financial results at AMD were being overshadowed by continued selling pressure and mixed technical momentum. The latest technical picture reinforces this dynamic, with the current trading range and prevailing downside risk highlighting the need for close attention to resistance at $465.53 as a potential inflection point.











-
 Afghanistan
-
 Albania
-
 Algeria
-
 Angola
-
 Argentina
-
 Armenia
-
 Australia
-
 Austria
-
 Azerbaijan
-
 Bahamas
-
 Bahrain
-
 Bangladesh
-
 Belarus
-
 Belgium
-
 Bolivia
-
 Botswana
-
 Brazil
-
 Brunei
-
 Bulgaria
-
 Cambodia
-
 Cameroon
-
 Canada
-
 Chile
-
 China
-
 Colombia
-
 Congo
-
 Costa Rica
-
 Cote d'Ivoire
-
 Croatia
-
 Cuba
-
 Cyprus
-
 Czechia
-
 DR Congo
-
 Denmark
-
 Dominican Republic
-
 Ecuador
-
 Egypt
-
 El Salvador
-
 Estonia
-
 Eswatini
-
 Ethiopia
-
 Finland
-
 France
-
 Georgia
-
 Germany
-
 Ghana
-
 Greece
-
 Haiti
-
 Hong Kong
-
 Hungary
-
 India
-
 Indonesia
-
 Iran, Islamic republic
-
 Iraq
-
 Ireland
-
 Israel
-
 Italy
-
 Jamaica
-
 Japan
-
 Jordan
-
 Kazakhstan
-
 Kenya
-
 Korea
-
 Kuwait
-
 Kyrgyzstan
-
 Laos
-
 Latvia
-
 Lebanon
-
 Lesotho
-
 Libya
-
 Lithuania
-
 Luxembourg
-
 Madagascar
-
 Malaysia
-
 Malta
-
 Mauritius
-
 Mexico
-
 Moldova
-
 Mongolia
-
 Montenegro
-
 Morocco
-
 Mozambique
-
 Myanmar
-
 Namibia
-
 Nepal
-
 Netherlands
-
 New Zealand
-
 Nigeria
-
 North Macedonia
-
 Norway
-
 Oman
-
 Pakistan
-
 Palestine
-
 Panama
-
 Papua New Guinea
-
 Paraguay
-
 Peru
-
 Philippines
-
 Poland
-
 Portugal
-
 Puerto Rico
-
 Qatar
-
 Reunion
-
 Romania
-
 Rwanda
-
 Saudi Arabia
-
 Serbia
-
 Singapore
-
 Slovakia
-
 Slovenia
-
 Somalia
-
 South Africa
-
 Spain
-
 Sri Lanka
-
 Sweden
-
 Switzerland
-
 Syria
-
 Taiwan
-
 Tajikistan
-
 Tanzania
-
 Thailand
-
 Trinidad and Tobago
-
 Tunisia
-
 Turkey
-
 UAE
-
 Uganda
-
 Ukraine
-
 United Kingdom
-
United States
-
 Uruguay
-
 Uzbekistan
-
 Venezuela
-
 Vietnam
-
 Yemen
-
 Zambia
-
 Zimbabwe
- Forex
- Crypto












