

Core Scientific stock tests $16.66 resistance as sellers dominate short-term trend

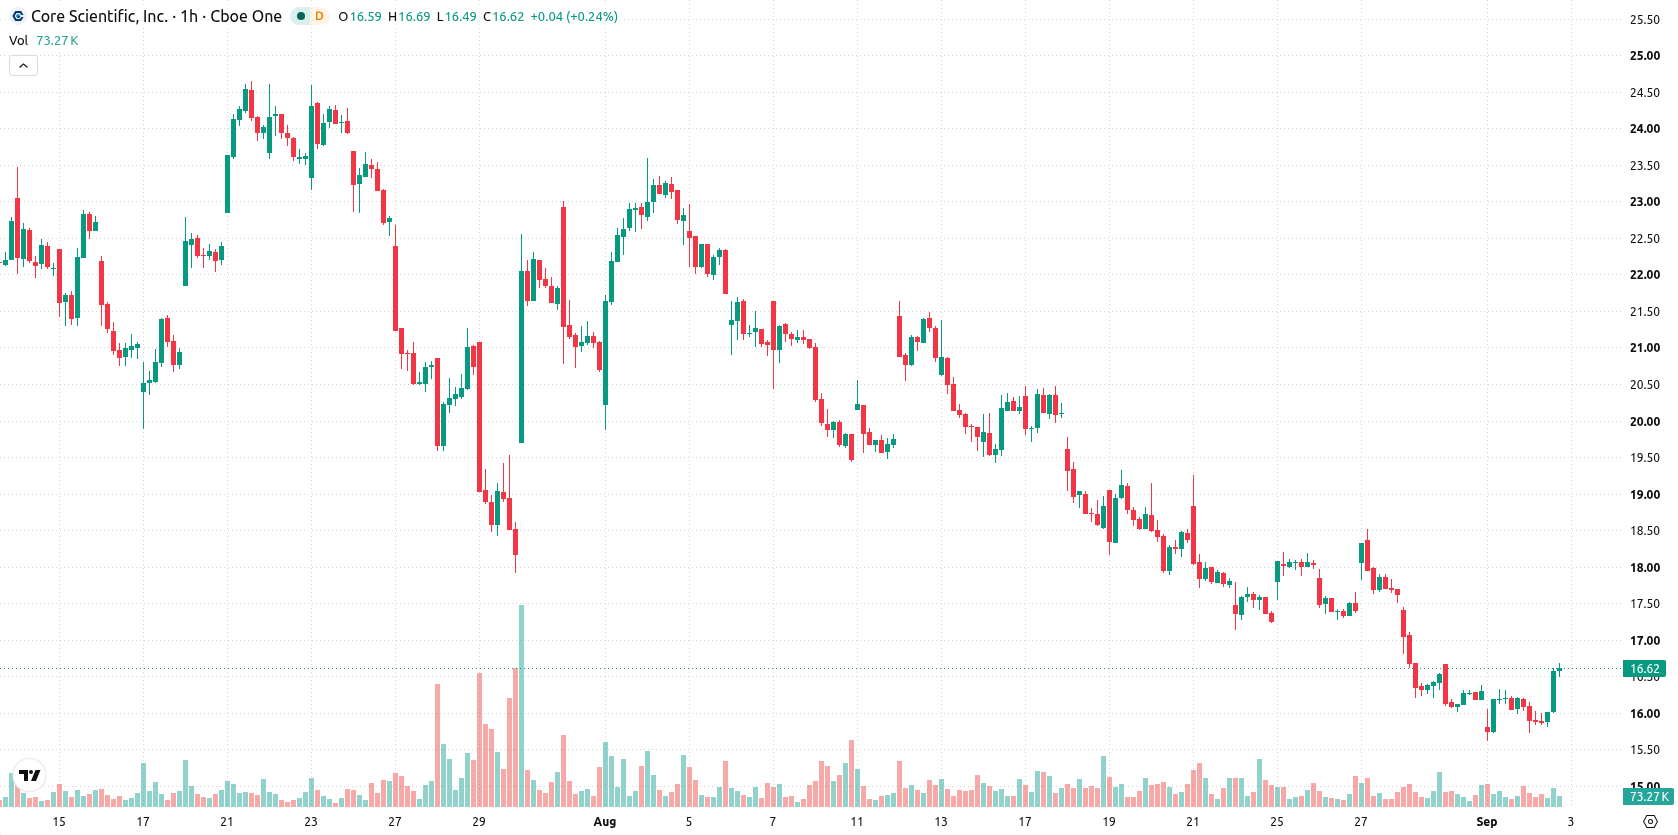
Core Scientific (CORZ) stock is trading at $16.58, marking a daily increase of 3.17%. The price sits above its key short-term moving averages but remains under longer-term averages.
 13.68
15.01
Highlights
- CORZ/USD trades above its short-term moving average but remains below medium- and long-term levels, indicating short-term strength within a bearish trend.
- Technical indicators are mixed, with oscillators in overbought territory and momentum signals skewed toward further downside pressure.
- Expected trading range is $15.29 to $17.87 with a 57% probability of a downward move and a baseline scenario for sideways price action.
Mixed technical signals as resistance and downside momentum persist
On the hourly chart, CORZ is trading above the MA-20 but remains below the MA-50 and MA-200. The Ichimoku Kijun resistance stands at $16.66, defining the immediate technical barrier. MACD registers a Strong Sell while ADX also issues a Sell signal, both pointing to continued downside momentum. RSI is at 46.87, indicating further weakness, while CCI remains Neutral and Stochastic RSI is in Overbought territory, flagging heightened risk of a short-term pullback. Despite this, Bull/Bear Power comes in at Strong Buy, showing buyer strength intraday but clashing with the broader bearish readings from other indicators.
Sideways trading likely as bearish bias edges out
Over the next several sessions, CORZ is expected to trade between $15.29 and $17.87, reflecting its typical volatility band relative to current levels. The probability of a downward move is higher at 57%, with a 43% chance of an upward move. The baseline scenario is further sideways action within this range, while a break above $16.66 could send the price toward the upper boundary, and a sustained move below support risks a fall to the lower end of the corridor.
Previously it was reported that Core Scientific’s outlook had turned increasingly bearish amid persistent downside risks despite improved liquidity. The latest technical signals highlight ongoing volatility and ongoing bearish pressures, making the $16.66 resistance a critical threshold for any potential upward move.










-
 Afghanistan
-
 Albania
-
 Algeria
-
 Angola
-
 Argentina
-
 Armenia
-
 Australia
-
 Austria
-
 Azerbaijan
-
 Bahamas
-
 Bahrain
-
 Bangladesh
-
 Belarus
-
 Belgium
-
 Bolivia
-
 Botswana
-
 Brazil
-
 Brunei
-
 Bulgaria
-
 Cambodia
-
 Cameroon
-
 Canada
-
 Chile
-
 China
-
 Colombia
-
 Congo
-
 Costa Rica
-
 Cote d'Ivoire
-
 Croatia
-
 Cuba
-
 Cyprus
-
 Czechia
-
 DR Congo
-
 Denmark
-
 Dominican Republic
-
 Ecuador
-
 Egypt
-
 El Salvador
-
 Estonia
-
 Eswatini
-
 Ethiopia
-
 Finland
-
 France
-
 Georgia
-
 Germany
-
 Ghana
-
 Greece
-
 Haiti
-
 Hong Kong
-
 Hungary
-
 India
-
 Indonesia
-
 Iran, Islamic republic
-
 Iraq
-
 Ireland
-
 Israel
-
 Italy
-
 Jamaica
-
 Japan
-
 Jordan
-
 Kazakhstan
-
 Kenya
-
 Korea
-
 Kuwait
-
 Kyrgyzstan
-
 Laos
-
 Latvia
-
 Lebanon
-
 Lesotho
-
 Libya
-
 Lithuania
-
 Luxembourg
-
 Madagascar
-
 Malaysia
-
 Malta
-
 Mauritius
-
 Mexico
-
 Moldova
-
 Mongolia
-
 Montenegro
-
 Morocco
-
 Mozambique
-
 Myanmar
-
 Namibia
-
 Nepal
-
 Netherlands
-
 New Zealand
-
 Nigeria
-
 North Macedonia
-
 Norway
-
 Oman
-
 Pakistan
-
 Palestine
-
 Panama
-
 Papua New Guinea
-
 Paraguay
-
 Peru
-
 Philippines
-
 Poland
-
 Portugal
-
 Puerto Rico
-
 Qatar
-
 Reunion
-
 Romania
-
 Rwanda
-
 Saudi Arabia
-
 Serbia
-
 Singapore
-
 Slovakia
-
 Slovenia
-
 Somalia
-
 South Africa
-
 Spain
-
 Sri Lanka
-
 Sweden
-
 Switzerland
-
 Syria
-
 Taiwan
-
 Tajikistan
-
 Tanzania
-
 Thailand
-
 Trinidad and Tobago
-
 Tunisia
-
 Turkey
-
 UAE
-
 Uganda
-
 Ukraine
-
 United Kingdom
-
United States
-
 Uruguay
-
 Uzbekistan
-
 Venezuela
-
 Vietnam
-
 Yemen
-
 Zambia
-
 Zimbabwe
- Forex
- Crypto












