

TELUS shares technical analysis: Resistance test at C$13.61 as rally unfolds

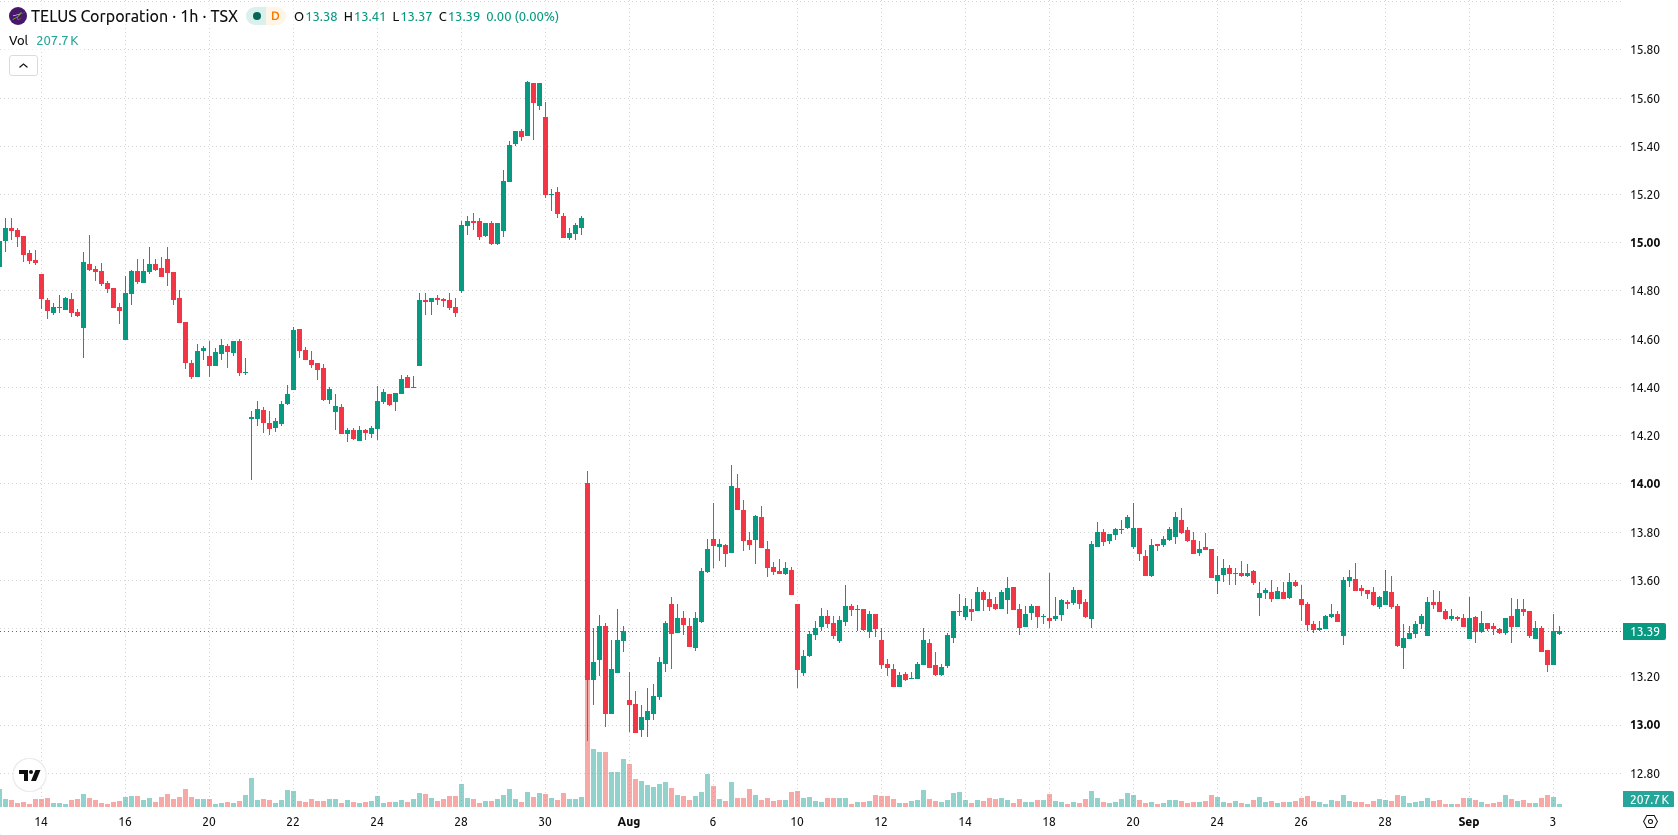
TELUS (T) stock is trading at C$13.43 after a 1.44% rise today, showing a positive daily move. The current price sits above its key moving averages on the shortest timeframes, while remaining under the more established averages.
 13.91
12.65
Highlights
- TELUS stock trades above short-term averages but remains below medium- and long-term trend resistance, indicating limited upside momentum.
- Momentum and oscillator signals are mostly bearish, with MACD and AO both indicating potential for further declines.
- Over the next 2 to 3 days, TELUS stock is expected to trade in a C$13.10 to C$13.61 range, with a 71% chance of decline.
Bearish momentum clashes with support amid intraday rebound
On the hourly chart, the MA-20 at C$13.41 marks the initial support level, while the MA-50 sits at C$13.47 and the MA-200 at C$16.99, forming overhead resistance zones. The Ichimoku Kijun at C$13.39 provides further immediate support. Momentum signals are generally bearish: MACD indicates a Sell, ADX remains Neutral, RSI is at 34.31, and both CCI and Stochastic RSI are in oversold territory, suggesting exhaustion after recent selling. Bull/Bear Power shows sellers dominate intraday, and the Awesome Oscillator (AO) also confirms a negative bias, highlighting divergence between today's intraday rebound and prevailing downside momentum.
Sideways consolidation expected as downside risk outweighs upside
Over the next 2–3 trading days, T is expected to trade within a corridor of C$13.10 to C$13.61, reflecting typical volatility for current conditions. The probability of an upward move stands at 29%, while the likelihood of a decline is 71%. The baseline scenario anticipates sideways consolidation inside this range, with a potential bullish breakout challenging upper resistance or, conversely, a breakdown below support raising the risk of further downside.
Earlier, analysts noted that while TELUS faced downside risks and technical weakness, efforts such as dividend adjustments and debt reduction could provide longer-term support. The current analysis highlights that persistent bearish momentum prevails despite short-term rebounds, making a potential breakdown below immediate support the key risk to monitor in the next few sessions.









-
 Afghanistan
-
 Albania
-
 Algeria
-
 Angola
-
 Argentina
-
 Armenia
-
 Australia
-
 Austria
-
 Azerbaijan
-
 Bahamas
-
 Bahrain
-
 Bangladesh
-
 Belarus
-
 Belgium
-
 Bolivia
-
 Botswana
-
 Brazil
-
 Brunei
-
 Bulgaria
-
 Cambodia
-
 Cameroon
-
 Canada
-
 Chile
-
 China
-
 Colombia
-
 Congo
-
 Costa Rica
-
 Cote d'Ivoire
-
 Croatia
-
 Cuba
-
 Cyprus
-
 Czechia
-
 DR Congo
-
 Denmark
-
 Dominican Republic
-
 Ecuador
-
 Egypt
-
 El Salvador
-
 Estonia
-
 Eswatini
-
 Ethiopia
-
 Finland
-
 France
-
 Georgia
-
 Germany
-
 Ghana
-
 Greece
-
 Haiti
-
 Hong Kong
-
 Hungary
-
 India
-
 Indonesia
-
 Iran, Islamic republic
-
 Iraq
-
 Ireland
-
 Israel
-
 Italy
-
 Jamaica
-
 Japan
-
 Jordan
-
 Kazakhstan
-
 Kenya
-
 Korea
-
 Kuwait
-
 Kyrgyzstan
-
 Laos
-
 Latvia
-
 Lebanon
-
 Lesotho
-
 Libya
-
 Lithuania
-
 Luxembourg
-
 Madagascar
-
 Malaysia
-
 Malta
-
 Mauritius
-
 Mexico
-
 Moldova
-
 Mongolia
-
 Montenegro
-
 Morocco
-
 Mozambique
-
 Myanmar
-
 Namibia
-
 Nepal
-
 Netherlands
-
 New Zealand
-
 Nigeria
-
 North Macedonia
-
 Norway
-
 Oman
-
 Pakistan
-
 Palestine
-
 Panama
-
 Papua New Guinea
-
 Paraguay
-
 Peru
-
 Philippines
-
 Poland
-
 Portugal
-
 Puerto Rico
-
 Qatar
-
 Reunion
-
 Romania
-
 Rwanda
-
 Saudi Arabia
-
 Serbia
-
 Singapore
-
 Slovakia
-
 Slovenia
-
 Somalia
-
 South Africa
-
 Spain
-
 Sri Lanka
-
 Sweden
-
 Switzerland
-
 Syria
-
 Taiwan
-
 Tajikistan
-
 Tanzania
-
 Thailand
-
 Trinidad and Tobago
-
 Tunisia
-
 Turkey
-
 UAE
-
 Uganda
-
 Ukraine
-
 United Kingdom
-
United States
-
 Uruguay
-
 Uzbekistan
-
 Venezuela
-
 Vietnam
-
 Yemen
-
 Zambia
-
 Zimbabwe
- Forex
- Crypto












