

GIS drops as sellers keep control of short-term trend

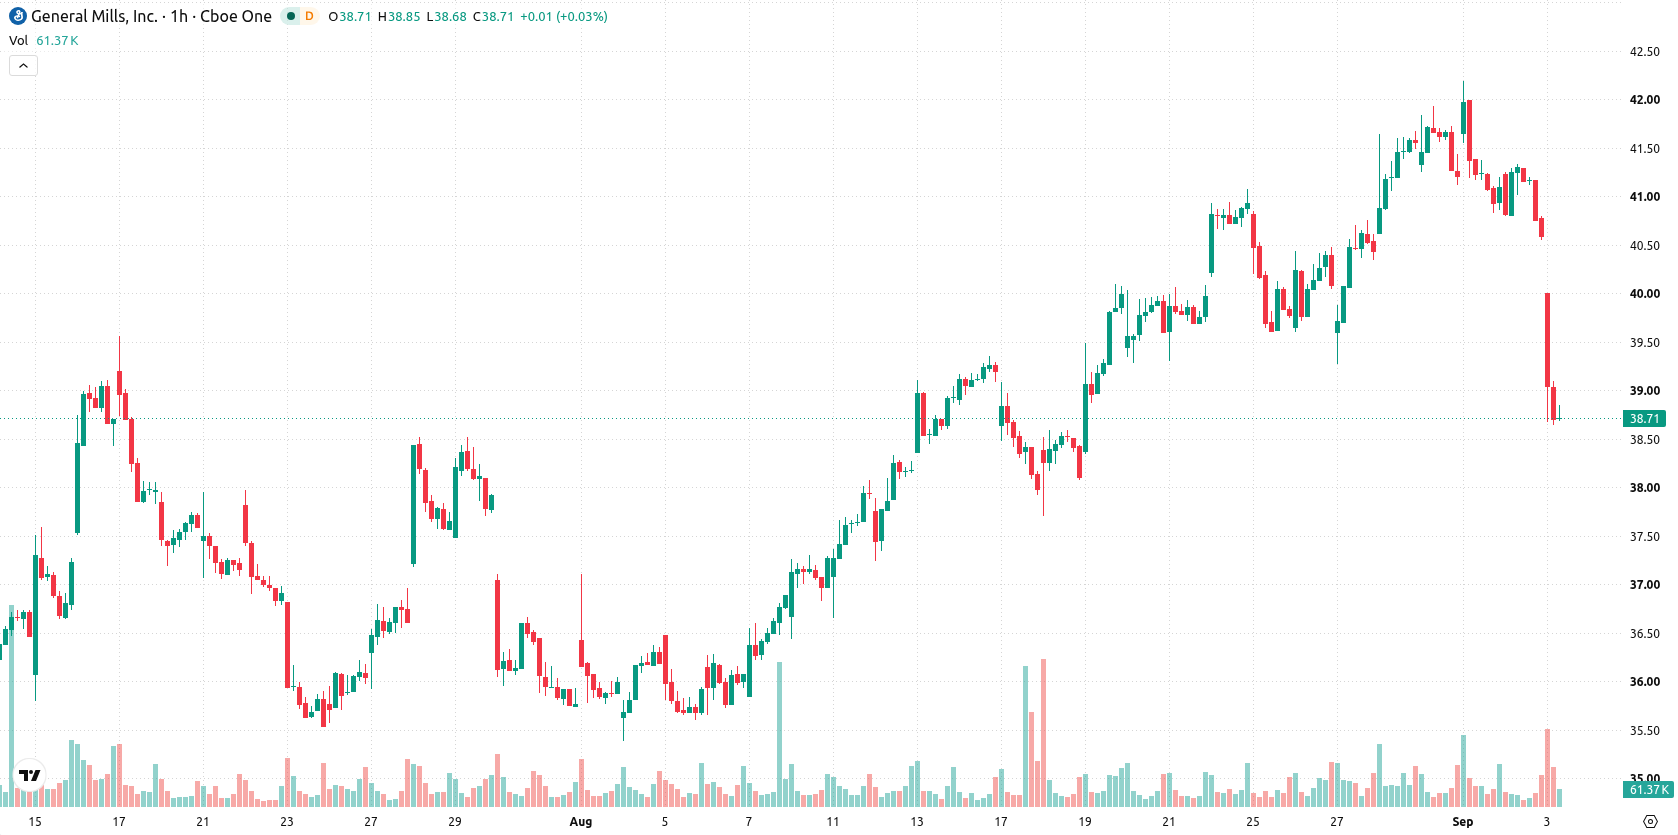
General Mills (GIS) stock is trading at $38.74 following a sharp intraday drop of 4.55%. The stock remains below its key moving averages, signaling a sustained bearish bias in the near-term price action.
 35.03
35.03
Highlights
- GIS/USD trades below key moving averages across all timeframes, establishing a bearish trend dominating short, medium, and long term.
- Oversold readings on Stoch RSI and CCI suggest short-term selling exhaustion, though MACD and ADX remain neutral and trend conviction is weak.
- Price dropped 4.55% to $38.74 with high volatility, and the next sessions are expected to range between $38 to $39.48, with 79% probability of further downside.
Mixed momentum and oversold signals as price tests technical floors
On the technical front, GIS is trading below the MA-20 ($41.26) and MA-50 ($40.79) on the H1 chart, as well as below the MA-200 ($39.99) on the daily timeframe. The Ichimoku Kijun resistance sits at $41.39. Momentum indicators are mixed: MACD and ADX show neutral readings, while RSI is at 41.21 (Sell). Both Stoch RSI and CCI are oversold, signaling short-term selling exhaustion, but Bull/Bear Power confirms sellers are in control during intraday trading.
Downside risks prevail unless breakout surpasses key resistance
Looking ahead, the anticipated price range for GIS in the short term is $38 to $39.48, with a 79% probability of further downside and only a 21% chance of an upward reversal. The base case remains for price consolidation within this volatility band. A bullish break above $41.39 would be needed to shift the outlook, while a decisive move below $38 would suggest additional downside risk.
Earlier, analysts noted that General Mills was exhibiting technical weakness and downside vulnerability amid continued consolidation. The latest chart signals reinforce this bearish bias, with a sustained breach of $38 likely exposing the stock to further downside risk in the near term.










-
 Afghanistan
-
 Albania
-
 Algeria
-
 Angola
-
 Argentina
-
 Armenia
-
 Australia
-
 Austria
-
 Azerbaijan
-
 Bahamas
-
 Bahrain
-
 Bangladesh
-
 Belarus
-
 Belgium
-
 Bolivia
-
 Botswana
-
 Brazil
-
 Brunei
-
 Bulgaria
-
 Cambodia
-
 Cameroon
-
 Canada
-
 Chile
-
 China
-
 Colombia
-
 Congo
-
 Costa Rica
-
 Cote d'Ivoire
-
 Croatia
-
 Cuba
-
 Cyprus
-
 Czechia
-
 DR Congo
-
 Denmark
-
 Dominican Republic
-
 Ecuador
-
 Egypt
-
 El Salvador
-
 Estonia
-
 Eswatini
-
 Ethiopia
-
 Finland
-
 France
-
 Georgia
-
 Germany
-
 Ghana
-
 Greece
-
 Haiti
-
 Hong Kong
-
 Hungary
-
 India
-
 Indonesia
-
 Iran, Islamic republic
-
 Iraq
-
 Ireland
-
 Israel
-
 Italy
-
 Jamaica
-
 Japan
-
 Jordan
-
 Kazakhstan
-
 Kenya
-
 Korea
-
 Kuwait
-
 Kyrgyzstan
-
 Laos
-
 Latvia
-
 Lebanon
-
 Lesotho
-
 Libya
-
 Lithuania
-
 Luxembourg
-
 Madagascar
-
 Malaysia
-
 Malta
-
 Mauritius
-
 Mexico
-
 Moldova
-
 Mongolia
-
 Montenegro
-
 Morocco
-
 Mozambique
-
 Myanmar
-
 Namibia
-
 Nepal
-
 Netherlands
-
 New Zealand
-
 Nigeria
-
 North Macedonia
-
 Norway
-
 Oman
-
 Pakistan
-
 Palestine
-
 Panama
-
 Papua New Guinea
-
 Paraguay
-
 Peru
-
 Philippines
-
 Poland
-
 Portugal
-
 Puerto Rico
-
 Qatar
-
 Reunion
-
 Romania
-
 Rwanda
-
 Saudi Arabia
-
 Serbia
-
 Singapore
-
 Slovakia
-
 Slovenia
-
 Somalia
-
 South Africa
-
 Spain
-
 Sri Lanka
-
 Sweden
-
 Switzerland
-
 Syria
-
 Taiwan
-
 Tajikistan
-
 Tanzania
-
 Thailand
-
 Trinidad and Tobago
-
 Tunisia
-
 Turkey
-
 UAE
-
 Uganda
-
 Ukraine
-
 United Kingdom
-
United States
-
 Uruguay
-
 Uzbekistan
-
 Venezuela
-
 Vietnam
-
 Yemen
-
 Zambia
-
 Zimbabwe
- Forex
- Crypto












