

FactSet stock falls over 3% as steady selling pressure follows downside gap at open

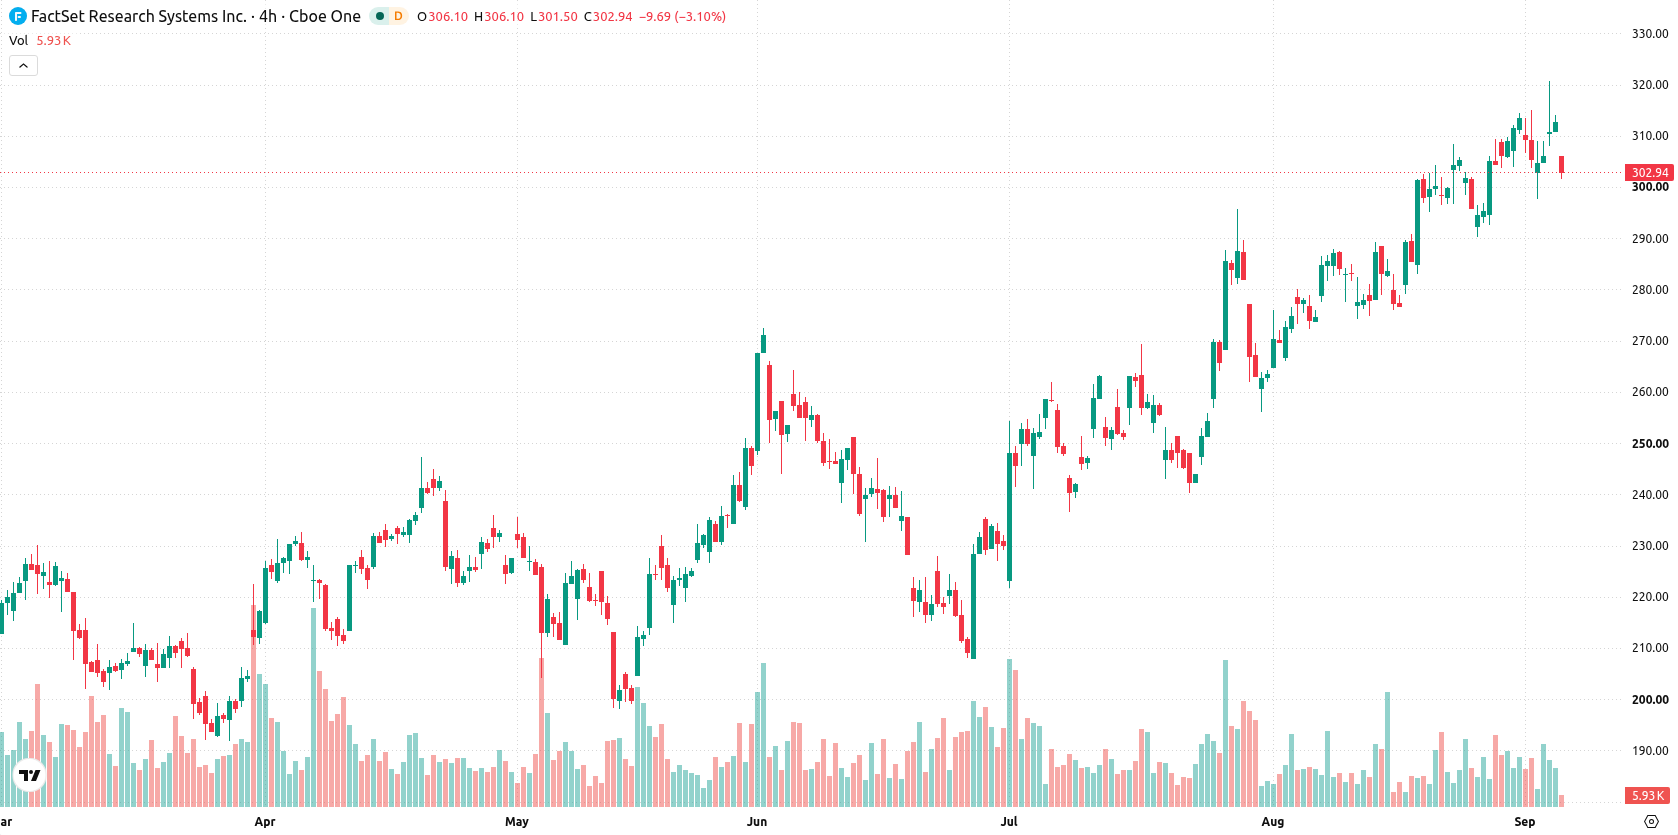
FactSet Research Systems Inc. (FDS) slid 3.03% after steady selling pressure dominated following a downside gap at the open. The move is supported by overbought signals on several oscillators and the asset trading near well-defined support within a strong technical uptrend.
 332.67
Highlights
- FactSet will report fourth quarter fiscal 2026 financial results on September 30, 2026, for the period ending August 31, 2026.
- Investors await updates on revenue growth, margin trends, and capital allocation as the company's primary revenue stream remains its data and analytics platforms.
- Shares of FactSet are trading above short-, medium-, and long-term averages with a projected five-day range of $291.83 to $314.63, though technical indicators warn of overbought conditions despite recent price pressure.
Investor focus on earnings timing as selling persists pre-results
FactSet has scheduled the release of its fourth quarter fiscal 2026 financial and operating results for September 30, 2026, covering the period ending August 31, 2026. Investors are monitoring the upcoming earnings presentation and management commentary for insights into revenue growth, margin trends, and capital allocation. The company's primary revenue stream remains its integrated financial data and analytics platforms, though price action has remained under broader selling pressure.
Overbought momentum persists as price tests strong technical boundaries
FactSet is trading above its 20-day, 50-day, and 200-day moving averages ($295.48, $270.91, and $249.58), signaling continued bullish momentum in the short-, medium-, and long-term trends. The nearest resistance is at $306.11 and near-term support is at $301.58, both well-defined by today's trading range. The longer-term outlook is reinforced by the bullish alignment between the MA-50 and MA-200. Momentum remains strong, supported by the MACD and ADX, but multiple indicators—including the RSI, Stochastic RSI, CCI, and BBP—are signaling overbought conditions, indicating the stock may be overextended. Intraday, the Awesome Oscillator continues to confirm the uptrend, yet sellers have dominated since the downside gap at the open. Intraday volatility stands at 1.50%, with FactSet currently trading mid-range after consistent selling throughout the session.
Earlier, analysts noted that FactSet's integration of artificial intelligence and ongoing client expansion had reinforced its longer-term bullish trend, even amid mixed technical signals and intermittent selling pressure. The latest price action adds a new dimension, as overbought momentum indicators and a sharp intraday decline highlight the importance of monitoring the $291.83 support for potential signs of short-term correction or continued consolidation ahead of upcoming earnings.






Latest FactSet Research Systems News




-
 Afghanistan
-
 Albania
-
 Algeria
-
 Angola
-
 Argentina
-
 Armenia
-
 Australia
-
 Austria
-
 Azerbaijan
-
 Bahamas
-
 Bahrain
-
 Bangladesh
-
 Belarus
-
 Belgium
-
 Bolivia
-
 Botswana
-
 Brazil
-
 Brunei
-
 Bulgaria
-
 Cambodia
-
 Cameroon
-
 Canada
-
 Chile
-
 China
-
 Colombia
-
 Congo
-
 Costa Rica
-
 Cote d'Ivoire
-
 Croatia
-
 Cuba
-
 Cyprus
-
 Czechia
-
 DR Congo
-
 Denmark
-
 Dominican Republic
-
 Ecuador
-
 Egypt
-
 El Salvador
-
 Estonia
-
 Eswatini
-
 Ethiopia
-
 Finland
-
 France
-
 Georgia
-
 Germany
-
 Ghana
-
 Greece
-
 Haiti
-
 Hong Kong
-
 Hungary
-
 India
-
 Indonesia
-
 Iran, Islamic republic
-
 Iraq
-
 Ireland
-
 Israel
-
 Italy
-
 Jamaica
-
 Japan
-
 Jordan
-
 Kazakhstan
-
 Kenya
-
 Korea
-
 Kuwait
-
 Kyrgyzstan
-
 Laos
-
 Latvia
-
 Lebanon
-
 Lesotho
-
 Libya
-
 Lithuania
-
 Luxembourg
-
 Madagascar
-
 Malaysia
-
 Malta
-
 Mauritius
-
 Mexico
-
 Moldova
-
 Mongolia
-
 Montenegro
-
 Morocco
-
 Mozambique
-
 Myanmar
-
 Namibia
-
 Nepal
-
 Netherlands
-
 New Zealand
-
 Nigeria
-
 North Macedonia
-
 Norway
-
 Oman
-
 Pakistan
-
 Palestine
-
 Panama
-
 Papua New Guinea
-
 Paraguay
-
 Peru
-
 Philippines
-
 Poland
-
 Portugal
-
 Puerto Rico
-
 Qatar
-
 Reunion
-
 Romania
-
 Rwanda
-
 Saudi Arabia
-
 Serbia
-
 Singapore
-
 Slovakia
-
 Slovenia
-
 Somalia
-
 South Africa
-
 Spain
-
 Sri Lanka
-
 Sweden
-
 Switzerland
-
 Syria
-
 Taiwan
-
 Tajikistan
-
 Tanzania
-
 Thailand
-
 Trinidad and Tobago
-
 Tunisia
-
 Turkey
-
 UAE
-
 Uganda
-
 Ukraine
-
 United Kingdom
-
United States
-
 Uruguay
-
 Uzbekistan
-
 Venezuela
-
 Vietnam
-
 Yemen
-
 Zambia
-
 Zimbabwe
- Forex
- Crypto












