

PTC shares drop almost 5% after lack of news and ongoing downside momentum

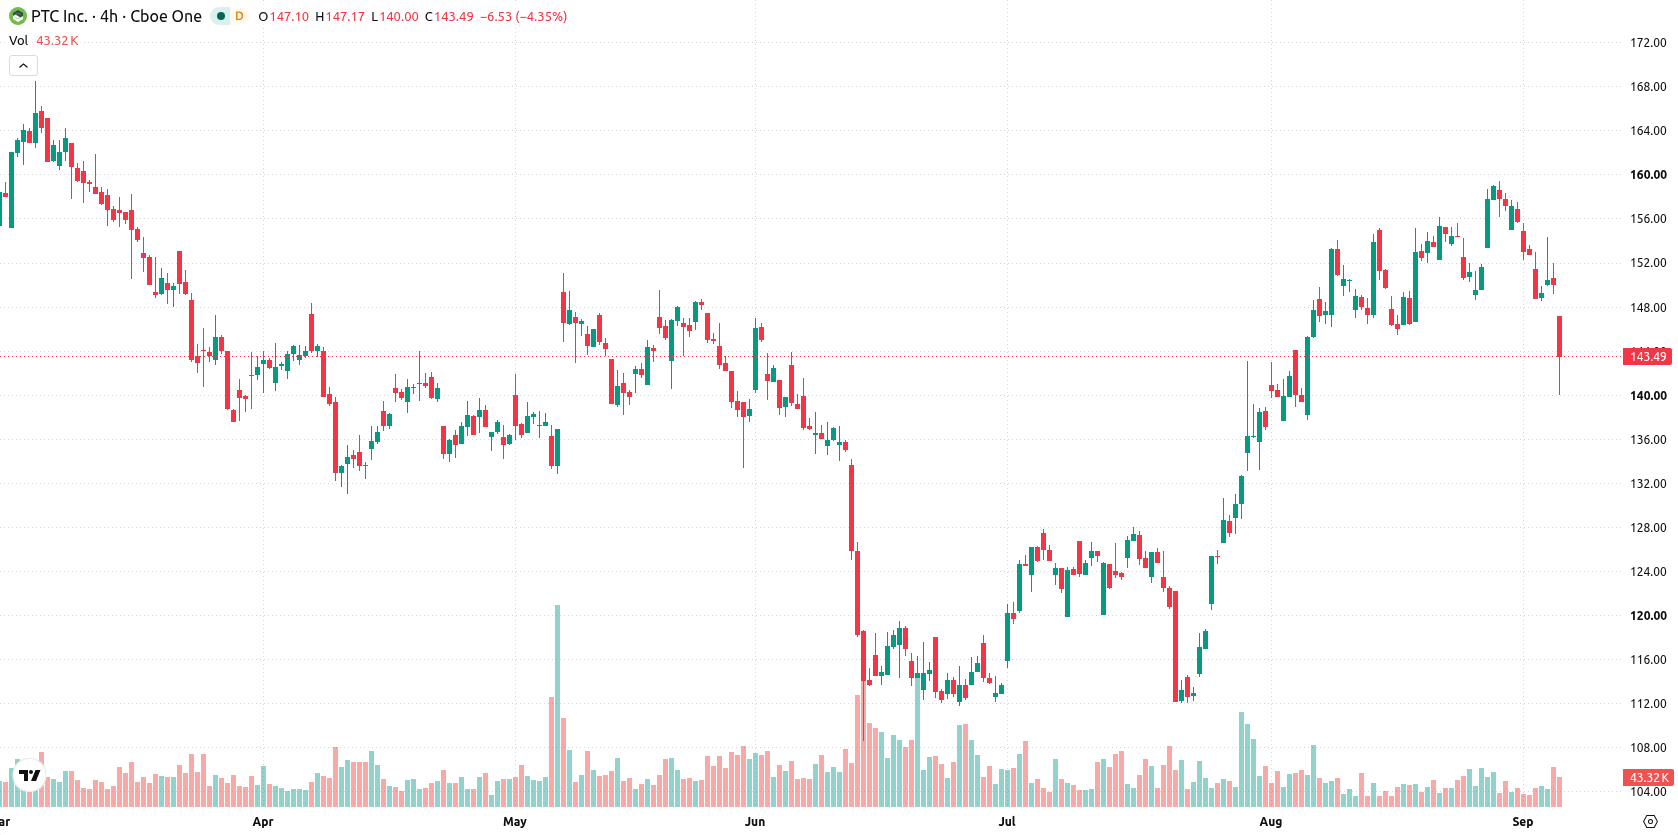
PTC Inc (PTC) fell 4.76% as selling pressure dominated in the absence of fresh corporate catalysts or news flow. The move is supported by the stock trading below both its 20-day and 200-day moving averages, highlighting continued downside risk.
 195.53
Highlights
- Shares of PTC are trading below both their 20-day and 200-day moving averages, indicating persistent selling pressure in short- and longer-term trends.
- Momentum signals are mixed, with the MACD and ADX in buy mode, but overbought and oversold readings flag potential near-term volatility.
- PTC stock is expected to trade between $138.33 and $150.82 over the next five days, with 12 buy, 7 sell, and 6 neutral signals supporting a baseline sideways scenario.
Mixed momentum persists as resistance and support converge
PTC is currently trading below its 20-day and 200-day moving averages ($151.74 and $148.88), but remains above the 50-day moving average ($135.94). This overall configuration shows both short- and long-term selling pressure are present, while some medium-term bullish momentum persists. Price action finds near-term resistance at $146.25 and support at $140.23. Momentum indicators present mixed signals: the MACD and ADX remain in buy mode, the RSI is neutral at 54.26, and the Stochastic RSI signals oversold conditions. The CCI and Awesome Oscillator are neutral, while BBP at 2.61 reflects intraday buyer dominance but also points to overbought levels. Active trading is evident, with volatility at 4.71% and mixed momentum intraday.
Earlier, analysts noted that PTC was facing strong bullish momentum but remained constrained by longer-term resistance. The current breakdown below both the 20-day and 200-day moving averages marks a notable shift in the technical outlook, with the prevailing scenario favoring a sustained period of sideways to downward trading unless the stock can reclaim levels above $146.25.









-
 Afghanistan
-
 Albania
-
 Algeria
-
 Angola
-
 Argentina
-
 Armenia
-
 Australia
-
 Austria
-
 Azerbaijan
-
 Bahamas
-
 Bahrain
-
 Bangladesh
-
 Belarus
-
 Belgium
-
 Bolivia
-
 Botswana
-
 Brazil
-
 Brunei
-
 Bulgaria
-
 Cambodia
-
 Cameroon
-
 Canada
-
 Chile
-
 China
-
 Colombia
-
 Congo
-
 Costa Rica
-
 Cote d'Ivoire
-
 Croatia
-
 Cuba
-
 Cyprus
-
 Czechia
-
 DR Congo
-
 Denmark
-
 Dominican Republic
-
 Ecuador
-
 Egypt
-
 El Salvador
-
 Estonia
-
 Eswatini
-
 Ethiopia
-
 Finland
-
 France
-
 Georgia
-
 Germany
-
 Ghana
-
 Greece
-
 Haiti
-
 Hong Kong
-
 Hungary
-
 India
-
 Indonesia
-
 Iran, Islamic republic
-
 Iraq
-
 Ireland
-
 Israel
-
 Italy
-
 Jamaica
-
 Japan
-
 Jordan
-
 Kazakhstan
-
 Kenya
-
 Korea
-
 Kuwait
-
 Kyrgyzstan
-
 Laos
-
 Latvia
-
 Lebanon
-
 Lesotho
-
 Libya
-
 Lithuania
-
 Luxembourg
-
 Madagascar
-
 Malaysia
-
 Malta
-
 Mauritius
-
 Mexico
-
 Moldova
-
 Mongolia
-
 Montenegro
-
 Morocco
-
 Mozambique
-
 Myanmar
-
 Namibia
-
 Nepal
-
 Netherlands
-
 New Zealand
-
 Nigeria
-
 North Macedonia
-
 Norway
-
 Oman
-
 Pakistan
-
 Palestine
-
 Panama
-
 Papua New Guinea
-
 Paraguay
-
 Peru
-
 Philippines
-
 Poland
-
 Portugal
-
 Puerto Rico
-
 Qatar
-
 Reunion
-
 Romania
-
 Rwanda
-
 Saudi Arabia
-
 Serbia
-
 Singapore
-
 Slovakia
-
 Slovenia
-
 Somalia
-
 South Africa
-
 Spain
-
 Sri Lanka
-
 Sweden
-
 Switzerland
-
 Syria
-
 Taiwan
-
 Tajikistan
-
 Tanzania
-
 Thailand
-
 Trinidad and Tobago
-
 Tunisia
-
 Turkey
-
 UAE
-
 Uganda
-
 Ukraine
-
 United Kingdom
-
United States
-
 Uruguay
-
 Uzbekistan
-
 Venezuela
-
 Vietnam
-
 Yemen
-
 Zambia
-
 Zimbabwe
- Forex
- Crypto












