

Why is Autodesk stock down today? Sellers dominate as next price targets to watch

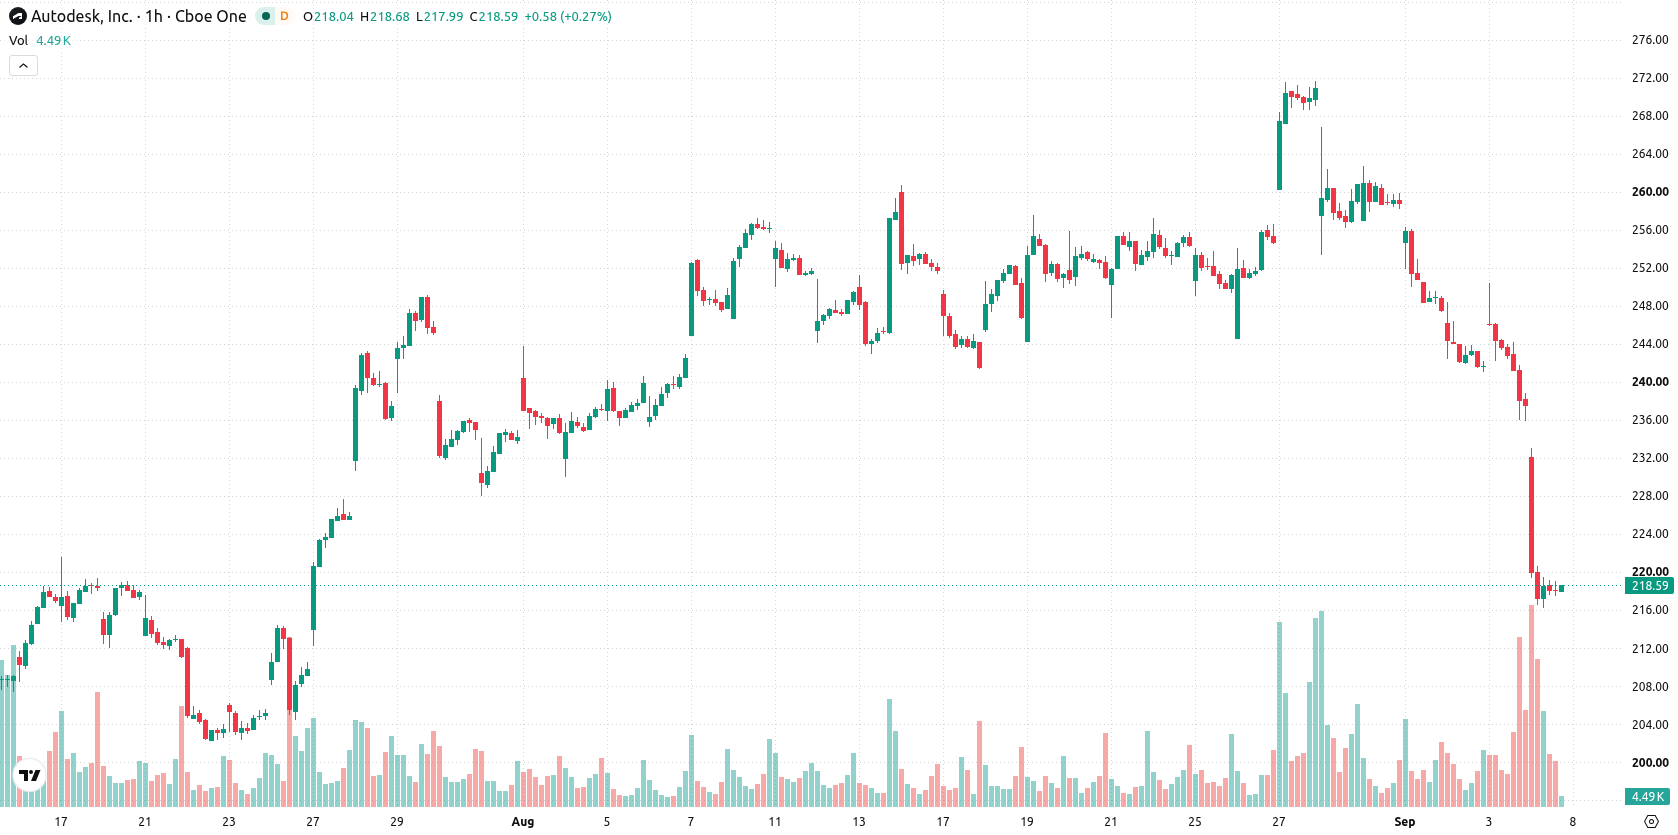
Autodesk Inc. (ADSK) stock is trading at $218.44, down 8.03% on the day. The price sits sharply below its key moving averages, highlighting continued downside pressure.
 264.46
278.71
Highlights
- Autodesk stock saw exceptionally low mid-day trading volume at 72% below average, indicating limited market participation.
- Reduced liquidity increased the impact of directional moves, potentially amplifying price swings and session volatility.
- Shares fell 8.03%, breaking below key moving averages with technical indicators showing strong downside momentum and projected range of $206.56 to $238.46.
Liquidity crunch intensifies price swings amid thin trading
Mid-day trading in Autodesk saw volume reported at 72% below the average daily level, according to Thecerbatgem. The sharp decline in trading activity suggests that market participation was severely limited, which often heightens the impact of directional moves during sessions marked by weakness. Reduced liquidity in this context can intensify price swings and exacerbate volatility as fewer participants are available to absorb large orders.
Bearish momentum persists as key averages and signals turn negative
On the technical front, ADSK remains well below its 20-period and 50-period moving averages on the H1 chart, and under the 200-period moving average on the daily timeframe. The Ichimoku Kijun is established at $248.51 and stands as immediate resistance. Momentum indicators are negative: MACD and ADX both signal 'Sell', while RSI, Stochastic RSI, and CCI are deep in oversold territory. Bull/Bear Power continues to reflect intraday seller dominance, and the Awesome Oscillator confirms the prevailing bearish outlook with a strong negative signal.
Increased downside risk as range-bound scenario faces volatility
Over the next two to three days, ADSK is expected to trade within a range of $206.56 to $238.46, reflecting typical volatility for recent sessions. There is a 79% probability of a further down move and 21% chance of recovery. The baseline scenario anticipates stabilization within this band; a break above $248.51 would shift expectations to a more positive tone, while failure to hold the lower end of the range may trigger additional downside momentum.
Earlier, analysts noted that Autodesk shares had entered a consolidation phase amid mixed technical signals and heightened volatility. The latest technical breakdown, combined with sharply reduced market participation, introduces a greater risk of further downside, making the $248.51 resistance level critical to watch for any signs of stabilization or potential recovery.











-
 Afghanistan
-
 Albania
-
 Algeria
-
 Angola
-
 Argentina
-
 Armenia
-
 Australia
-
 Austria
-
 Azerbaijan
-
 Bahamas
-
 Bahrain
-
 Bangladesh
-
 Belarus
-
 Belgium
-
 Bolivia
-
 Botswana
-
 Brazil
-
 Brunei
-
 Bulgaria
-
 Cambodia
-
 Cameroon
-
 Canada
-
 Chile
-
 China
-
 Colombia
-
 Congo
-
 Costa Rica
-
 Cote d'Ivoire
-
 Croatia
-
 Cuba
-
 Cyprus
-
 Czechia
-
 DR Congo
-
 Denmark
-
 Dominican Republic
-
 Ecuador
-
 Egypt
-
 El Salvador
-
 Estonia
-
 Eswatini
-
 Ethiopia
-
 Finland
-
 France
-
 Georgia
-
 Germany
-
 Ghana
-
 Greece
-
 Haiti
-
 Hong Kong
-
 Hungary
-
 India
-
 Indonesia
-
 Iran, Islamic republic
-
 Iraq
-
 Ireland
-
 Israel
-
 Italy
-
 Jamaica
-
 Japan
-
 Jordan
-
 Kazakhstan
-
 Kenya
-
 Korea
-
 Kuwait
-
 Kyrgyzstan
-
 Laos
-
 Latvia
-
 Lebanon
-
 Lesotho
-
 Libya
-
 Lithuania
-
 Luxembourg
-
 Madagascar
-
 Malaysia
-
 Malta
-
 Mauritius
-
 Mexico
-
 Moldova
-
 Mongolia
-
 Montenegro
-
 Morocco
-
 Mozambique
-
 Myanmar
-
 Namibia
-
 Nepal
-
 Netherlands
-
 New Zealand
-
 Nigeria
-
 North Macedonia
-
 Norway
-
 Oman
-
 Pakistan
-
 Palestine
-
 Panama
-
 Papua New Guinea
-
 Paraguay
-
 Peru
-
 Philippines
-
 Poland
-
 Portugal
-
 Puerto Rico
-
 Qatar
-
 Reunion
-
 Romania
-
 Rwanda
-
 Saudi Arabia
-
 Serbia
-
 Singapore
-
 Slovakia
-
 Slovenia
-
 Somalia
-
 South Africa
-
 Spain
-
 Sri Lanka
-
 Sweden
-
 Switzerland
-
 Syria
-
 Taiwan
-
 Tajikistan
-
 Tanzania
-
 Thailand
-
 Trinidad and Tobago
-
 Tunisia
-
 Turkey
-
 UAE
-
 Uganda
-
 Ukraine
-
 United Kingdom
-
United States
-
 Uruguay
-
 Uzbekistan
-
 Venezuela
-
 Vietnam
-
 Yemen
-
 Zambia
-
 Zimbabwe
- Forex
- Crypto












