

DOW slides around 3.5% as technical weakness persists below key moving averages

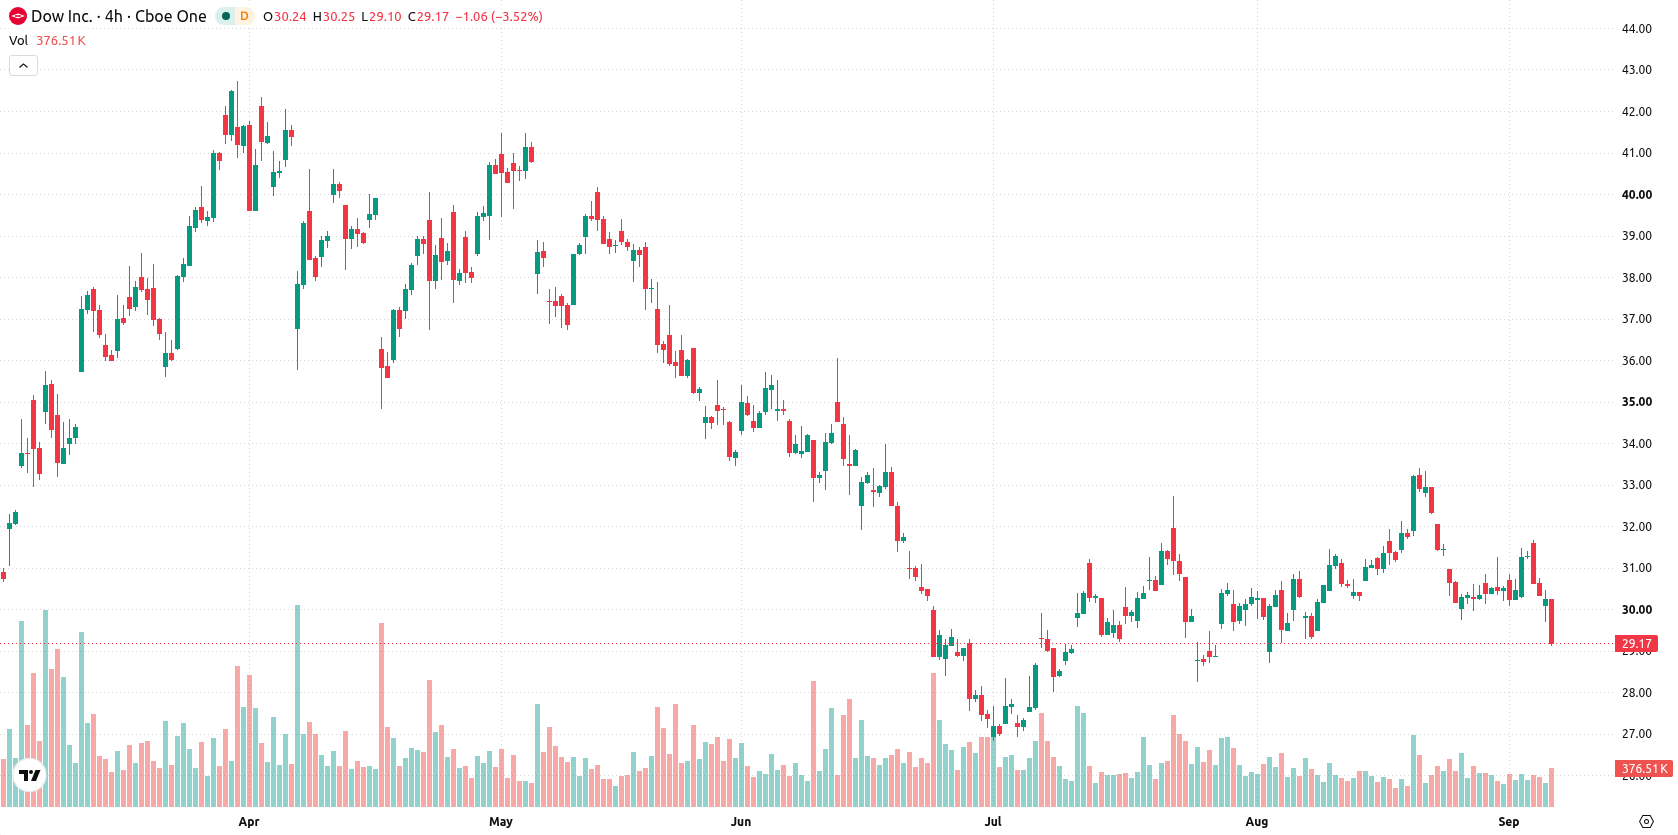
Dow Inc. (DOW) dropped 3.56% after investors pulled back in response to selling pressure, even as the company reported improved core earnings and EBITDA for the recent quarter. The downside move finds further support from Dow remaining below its 20-day, 50-day, and 200-day moving averages, highlighting sustained weakness across multiple timeframes.
 33.48
34.83
Highlights
- Dow Inc. reported year-on-year growth in adjusted earnings per share and operating EBITDA for the second quarter of 2026.
- The company allocated operating cash flow to dividends and growth investments as it recovers from difficult sector conditions in 2025.
- Shares of Dow remain pressured below key technical averages, with a 71% probability of trading between $28.59 and $29.97 over the next five days.
Cash distribution and cautious sentiment persist despite earnings rebound
Dow Inc. posted year-on-year growth in both adjusted earnings per share and operating EBITDA for the second quarter of 2026. The improvement marked a recovery from challenging sector conditions experienced in 2025. Some operating cash flow was allocated to dividends and selected growth investments as the company prepares for additional quarterly results, though price action has remained under broader selling pressure.
Bearish technical structure persists as momentum indicators diverge
Dow is trading below its 20-day, 50-day, and 200-day moving averages ($30.91, $30, and $31.44), pointing to continued pressure from sellers in the short, medium, and long term. The immediate resistance sits at $29.7, while support is seen at the near-term floor of $28.59. The current alignment between the MA-50 and MA-200 reinforces a bearish technical structure. Momentum indicators deliver mixed signals: MACD suggests strong buy momentum, but the ADX is neutral, indicating weak trend strength. The Relative Strength Index (RSI) registers 47.4 with a sell forecast; CCI and Awesome Oscillator are neutral, while Stochastic RSI signals oversold conditions at 6.19. Bull/Bear Power remains positive at 0.22, suggesting a slight intraday advantage for buyers, though broader bias stays negative. Intraday volatility is marked at 2.53% with the price near session lows and ongoing downside pressure after the open. Many oscillators and momentum readings are diverging, with the MACD hinting at potential for a rebound but price action and RSI still favoring sellers.
Earlier, analysts noted that Dow had shifted from a bullish phase to displaying increased downside pressure and technical weakness. The current analysis strengthens this outlook, with updated momentum indicators underscoring persistent selling and highlighting a move below $28.59 as a key downside risk to monitor in the days ahead.






Latest Dow Inc. News





-
 Afghanistan
-
 Albania
-
 Algeria
-
 Angola
-
 Argentina
-
 Armenia
-
 Australia
-
 Austria
-
 Azerbaijan
-
 Bahamas
-
 Bahrain
-
 Bangladesh
-
 Belarus
-
 Belgium
-
 Bolivia
-
 Botswana
-
 Brazil
-
 Brunei
-
 Bulgaria
-
 Cambodia
-
 Cameroon
-
 Canada
-
 Chile
-
 China
-
 Colombia
-
 Congo
-
 Costa Rica
-
 Cote d'Ivoire
-
 Croatia
-
 Cuba
-
 Cyprus
-
 Czechia
-
 DR Congo
-
 Denmark
-
 Dominican Republic
-
 Ecuador
-
 Egypt
-
 El Salvador
-
 Estonia
-
 Eswatini
-
 Ethiopia
-
 Finland
-
 France
-
 Georgia
-
 Germany
-
 Ghana
-
 Greece
-
 Haiti
-
 Hong Kong
-
 Hungary
-
 India
-
 Indonesia
-
 Iran, Islamic republic
-
 Iraq
-
 Ireland
-
 Israel
-
 Italy
-
 Jamaica
-
 Japan
-
 Jordan
-
 Kazakhstan
-
 Kenya
-
 Korea
-
 Kuwait
-
 Kyrgyzstan
-
 Laos
-
 Latvia
-
 Lebanon
-
 Lesotho
-
 Libya
-
 Lithuania
-
 Luxembourg
-
 Madagascar
-
 Malaysia
-
 Malta
-
 Mauritius
-
 Mexico
-
 Moldova
-
 Mongolia
-
 Montenegro
-
 Morocco
-
 Mozambique
-
 Myanmar
-
 Namibia
-
 Nepal
-
 Netherlands
-
 New Zealand
-
 Nigeria
-
 North Macedonia
-
 Norway
-
 Oman
-
 Pakistan
-
 Palestine
-
 Panama
-
 Papua New Guinea
-
 Paraguay
-
 Peru
-
 Philippines
-
 Poland
-
 Portugal
-
 Puerto Rico
-
 Qatar
-
 Reunion
-
 Romania
-
 Rwanda
-
 Saudi Arabia
-
 Serbia
-
 Singapore
-
 Slovakia
-
 Slovenia
-
 Somalia
-
 South Africa
-
 Spain
-
 Sri Lanka
-
 Sweden
-
 Switzerland
-
 Syria
-
 Taiwan
-
 Tajikistan
-
 Tanzania
-
 Thailand
-
 Trinidad and Tobago
-
 Tunisia
-
 Turkey
-
 UAE
-
 Uganda
-
 Ukraine
-
 United Kingdom
-
United States
-
 Uruguay
-
 Uzbekistan
-
 Venezuela
-
 Vietnam
-
 Yemen
-
 Zambia
-
 Zimbabwe
- Forex
- Crypto












