


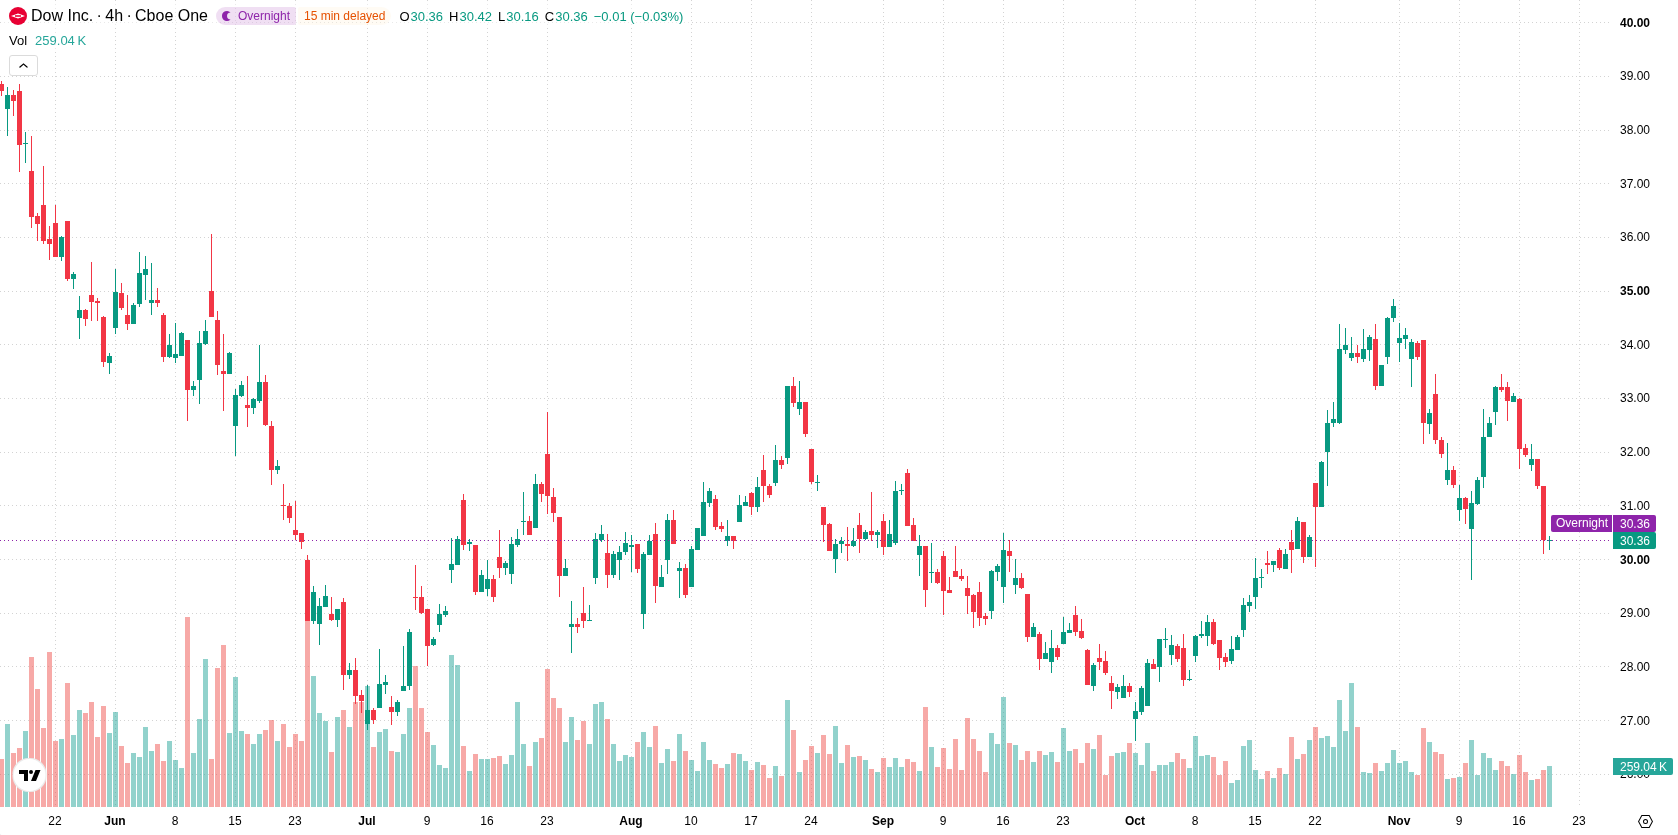
Dow Inc. (DOW) fell 3.86% after the company cut its dividend by 50% amid ongoing losses, signaling heightened concerns around near-term cash flow and income reliability. The move is supported by persistent downward pressure, with Dow trading below all major moving averages and the 50-day acting as the nearest resistance.
 30.52
32.92
Highlights
- Dow Inc. cut its dividend by 50%, reducing the yield to 4.4% amid recent substantial losses.
- Shares remain pressured as investors monitor Dow's ongoing cash flow turnaround and exposure to market cycles and geopolitical risk.
- Dow stock trades below major moving averages with a near-term range of $29.09 to $31.23 and mixed technical momentum signals.
Investor caution persists amid cash flow reforms and external risks
Dow Inc. reduced its dividend by 50% following significant losses, lowering its yield to 4.4%. The company is pursuing a cash flow turnaround, which remains closely watched by income-focused investors. Ongoing exposure to market cycles, competitive pressures, and geopolitical risks, especially in the Middle East, continue to influence Dow's outlook. Stakeholders are monitoring the company's financial performance and risk factors, though price action has remained under broader selling pressure.
Mixed momentum signals as Dow tests support below key averages
Dow is trading below its 20-day, 50-day, and 200-day moving averages at $32.67, $30.33, and $32.9, indicating sustained downward momentum and establishing a bearish trend over the medium to long term. The closest resistance is the 50-day moving average at $30.33, while the lower end of the forecast band at $29.09 sets a potential support level. Momentum signals remain mixed. The MACD suggests strong underlying buy signals, while the ADX points to a neutral trend. Both the RSI and CCI are in neutral territory, whereas the Stochastic RSI is in the oversold zone, opening scope for a possible upside rebound. The BBP shows that sellers control intraday momentum, although the Awesome Oscillator leans toward the buy side. Dow is down $1.21 or 3.86% intraday after a gap down of about 2.39%. The stock trades near its session low on above-average volatility, and the overall tone remains pressured following the open. Oscillator extremes are present, partially offsetting negative price action.
Earlier, analysts noted that Dow faced sustained bearish pressure, with technical indicators highlighting a greater likelihood of continued downside within a defined volatility range. The latest developments—specifically the dividend reduction and ongoing trading below major moving averages—reinforce this outlook, making the $29.09 support level a critical threshold for monitoring near-term risk.






Latest Dow Inc. News




-
 Afghanistan
-
 Albania
-
 Algeria
-
 Angola
-
 Argentina
-
 Armenia
-
 Australia
-
 Austria
-
 Azerbaijan
-
 Bahamas
-
 Bahrain
-
 Bangladesh
-
 Belarus
-
 Belgium
-
 Bolivia
-
 Botswana
-
 Brazil
-
 Brunei
-
 Bulgaria
-
 Cambodia
-
 Cameroon
-
 Canada
-
 Chile
-
 China
-
 Colombia
-
 Congo
-
 Costa Rica
-
 Cote d'Ivoire
-
 Croatia
-
 Cuba
-
 Cyprus
-
 Czechia
-
 DR Congo
-
 Denmark
-
 Dominican Republic
-
 Ecuador
-
 Egypt
-
 El Salvador
-
 Estonia
-
 Eswatini
-
 Ethiopia
-
 Finland
-
 France
-
 Georgia
-
 Germany
-
 Ghana
-
 Greece
-
 Haiti
-
 Hong Kong
-
 Hungary
-
 India
-
 Indonesia
-
 Iran, Islamic republic
-
 Iraq
-
 Ireland
-
 Israel
-
 Italy
-
 Jamaica
-
 Japan
-
 Jordan
-
 Kazakhstan
-
 Kenya
-
 Korea
-
 Kuwait
-
 Kyrgyzstan
-
 Laos
-
 Latvia
-
 Lebanon
-
 Lesotho
-
 Libya
-
 Lithuania
-
 Luxembourg
-
 Madagascar
-
 Malaysia
-
 Malta
-
 Mauritius
-
 Mexico
-
 Moldova
-
 Mongolia
-
 Montenegro
-
 Morocco
-
 Mozambique
-
 Myanmar
-
 Namibia
-
 Nepal
-
 Netherlands
-
 New Zealand
-
 Nigeria
-
 North Macedonia
-
 Norway
-
 Oman
-
 Pakistan
-
 Palestine
-
 Panama
-
 Papua New Guinea
-
 Paraguay
-
 Peru
-
 Philippines
-
 Poland
-
 Portugal
-
 Puerto Rico
-
 Qatar
-
 Reunion
-
 Romania
-
 Rwanda
-
 Saudi Arabia
-
 Serbia
-
 Singapore
-
 Slovakia
-
 Slovenia
-
 Somalia
-
 South Africa
-
 Spain
-
 Sri Lanka
-
 Sweden
-
 Switzerland
-
 Syria
-
 Taiwan
-
 Tajikistan
-
 Tanzania
-
 Thailand
-
 Trinidad and Tobago
-
 Tunisia
-
 Turkey
-
 UAE
-
 Uganda
-
 Ukraine
-
 United Kingdom
-
United States
-
 Uruguay
-
 Uzbekistan
-
 Venezuela
-
 Vietnam
-
 Yemen
-
 Zambia
-
 Zimbabwe
- Forex
- Crypto












