


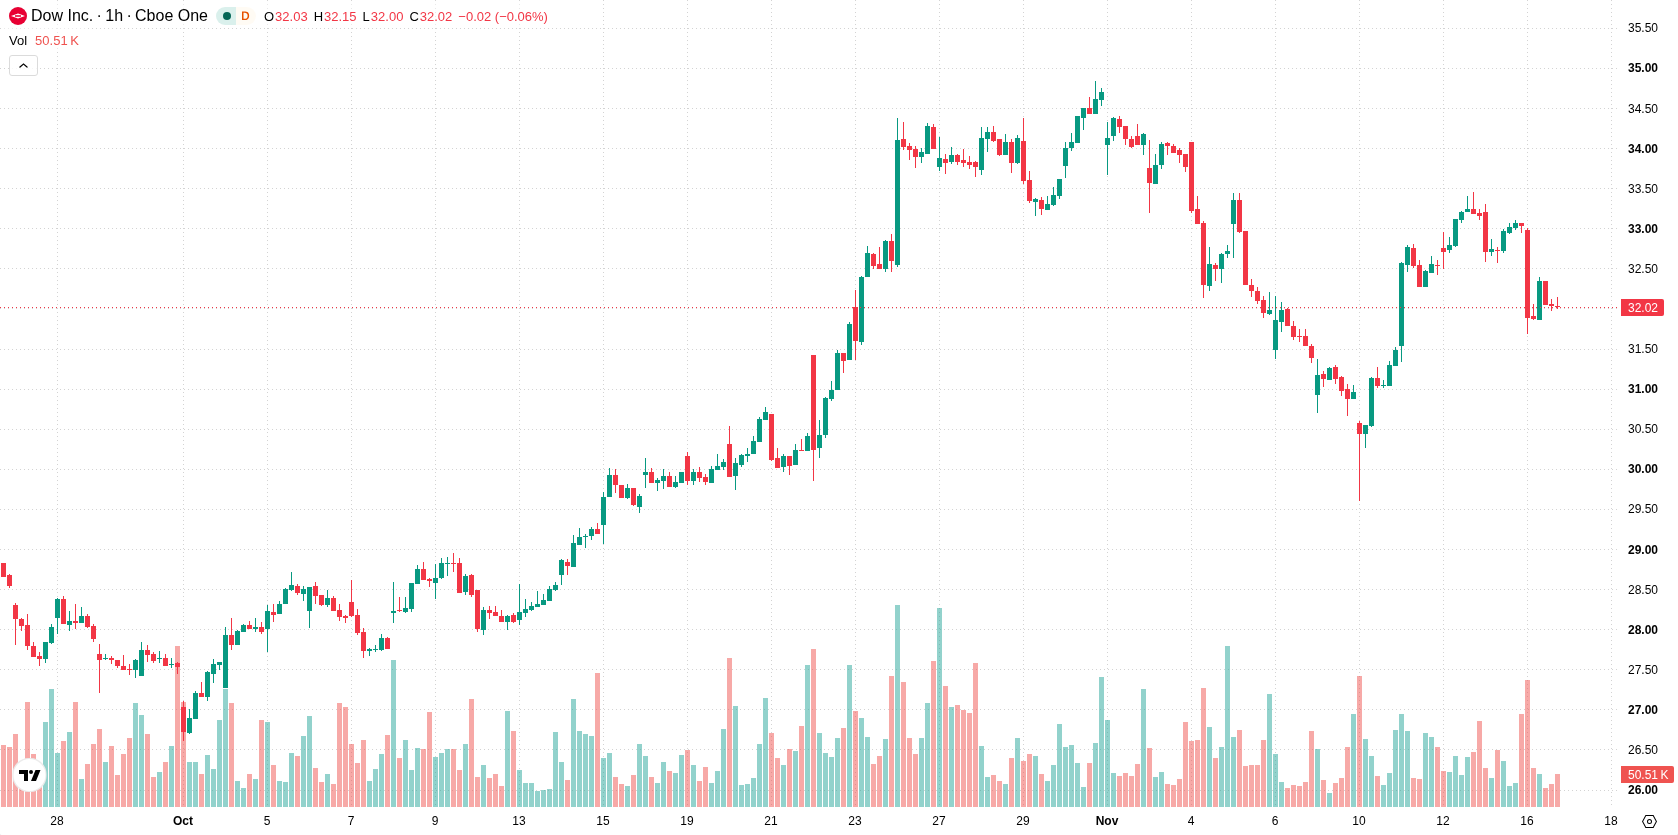
Dow (DOW) stock is trading at $31.96, down 3.27% for the day with a notable gap down, reflecting moderate volatility. The price currently sits below its key short-, medium-, and long-term moving averages, indicating persistent seller pressure.
 30.52
32.92
Highlights
- DOW/USD trades below key moving averages, indicating sustained selling pressure across short, medium, and long timeframes.
- The price has declined 3.27% for the day, now at 31.96 after a gap down with moderate volatility.
- Momentum and oscillators suggest a bearish trend with possible short-term rebounds, expecting consolidation between 30.29 to 33.63 over several days.
Oversold signals emerge amid persistent bearish momentum
Technically, DOW/USD trades below the H1 SMA-20 at $32.72, the H1 SMA-50 at $32.04, and the D1 SMA-200 at $32.86. Immediate resistance is marked by the Ichimoku Kijun at $32.47. Momentum signals remain mixed: the MACD is neutral, and ADX shows a sell bias, while RSI is neutral. Both Stochastic RSI and CCI are in oversold territory, suggesting possible short-term rebound potential. Bull/Bear Power at -0.35 indicates sellers continue to dominate, and the Awesome Oscillator offers a strong sell indication for the current session.
Downside risk heightened as consolidation dominates near-term outlook
In the short term, DOW is expected to trade within a range of $30.29 to $33.63, reflecting a volatility band relative to current levels. There is a 35% probability of an upside move, while a downward move remains more likely at 65%. The baseline scenario envisions consolidation inside this range. A bullish breakout above immediate resistance could prompt a recovery, while a breach of support may accelerate declines and extend the current downtrend.
Previously it was reported that Dow received regulatory approval to advance its pioneering nuclear project at the Seadrift Operations site, marking a significant step for next-generation energy integration into industrial operations. However, with DOW now trading under technical pressure and a higher probability of further declines, traders should monitor the $30.29 support level as a potential inflection point for near-term price action.






Latest Dow Inc. News





-
 Afghanistan
-
 Albania
-
 Algeria
-
 Angola
-
 Argentina
-
 Armenia
-
 Australia
-
 Austria
-
 Azerbaijan
-
 Bahamas
-
 Bahrain
-
 Bangladesh
-
 Belarus
-
 Belgium
-
 Bolivia
-
 Botswana
-
 Brazil
-
 Brunei
-
 Bulgaria
-
 Cambodia
-
 Cameroon
-
 Canada
-
 Chile
-
 China
-
 Colombia
-
 Congo
-
 Costa Rica
-
 Cote d'Ivoire
-
 Croatia
-
 Cuba
-
 Cyprus
-
 Czechia
-
 DR Congo
-
 Denmark
-
 Dominican Republic
-
 Ecuador
-
 Egypt
-
 El Salvador
-
 Estonia
-
 Eswatini
-
 Ethiopia
-
 Finland
-
 France
-
 Georgia
-
 Germany
-
 Ghana
-
 Greece
-
 Haiti
-
 Hong Kong
-
 Hungary
-
 India
-
 Indonesia
-
 Iran, Islamic republic
-
 Iraq
-
 Ireland
-
 Israel
-
 Italy
-
 Jamaica
-
 Japan
-
 Jordan
-
 Kazakhstan
-
 Kenya
-
 Korea
-
 Kuwait
-
 Kyrgyzstan
-
 Laos
-
 Latvia
-
 Lebanon
-
 Lesotho
-
 Libya
-
 Lithuania
-
 Luxembourg
-
 Madagascar
-
 Malaysia
-
 Malta
-
 Mauritius
-
 Mexico
-
 Moldova
-
 Mongolia
-
 Montenegro
-
 Morocco
-
 Mozambique
-
 Myanmar
-
 Namibia
-
 Nepal
-
 Netherlands
-
 New Zealand
-
 Nigeria
-
 North Macedonia
-
 Norway
-
 Oman
-
 Pakistan
-
 Palestine
-
 Panama
-
 Papua New Guinea
-
 Paraguay
-
 Peru
-
 Philippines
-
 Poland
-
 Portugal
-
 Puerto Rico
-
 Qatar
-
 Reunion
-
 Romania
-
 Rwanda
-
 Saudi Arabia
-
 Serbia
-
 Singapore
-
 Slovakia
-
 Slovenia
-
 Somalia
-
 South Africa
-
 Spain
-
 Sri Lanka
-
 Sweden
-
 Switzerland
-
 Syria
-
 Taiwan
-
 Tajikistan
-
 Tanzania
-
 Thailand
-
 Trinidad and Tobago
-
 Tunisia
-
 Turkey
-
 UAE
-
 Uganda
-
 Ukraine
-
 United Kingdom
-
United States
-
 Uruguay
-
 Uzbekistan
-
 Venezuela
-
 Vietnam
-
 Yemen
-
 Zambia
-
 Zimbabwe
- Forex
- Crypto












