

What's behind Entegris's latest 5.8% stock surge?

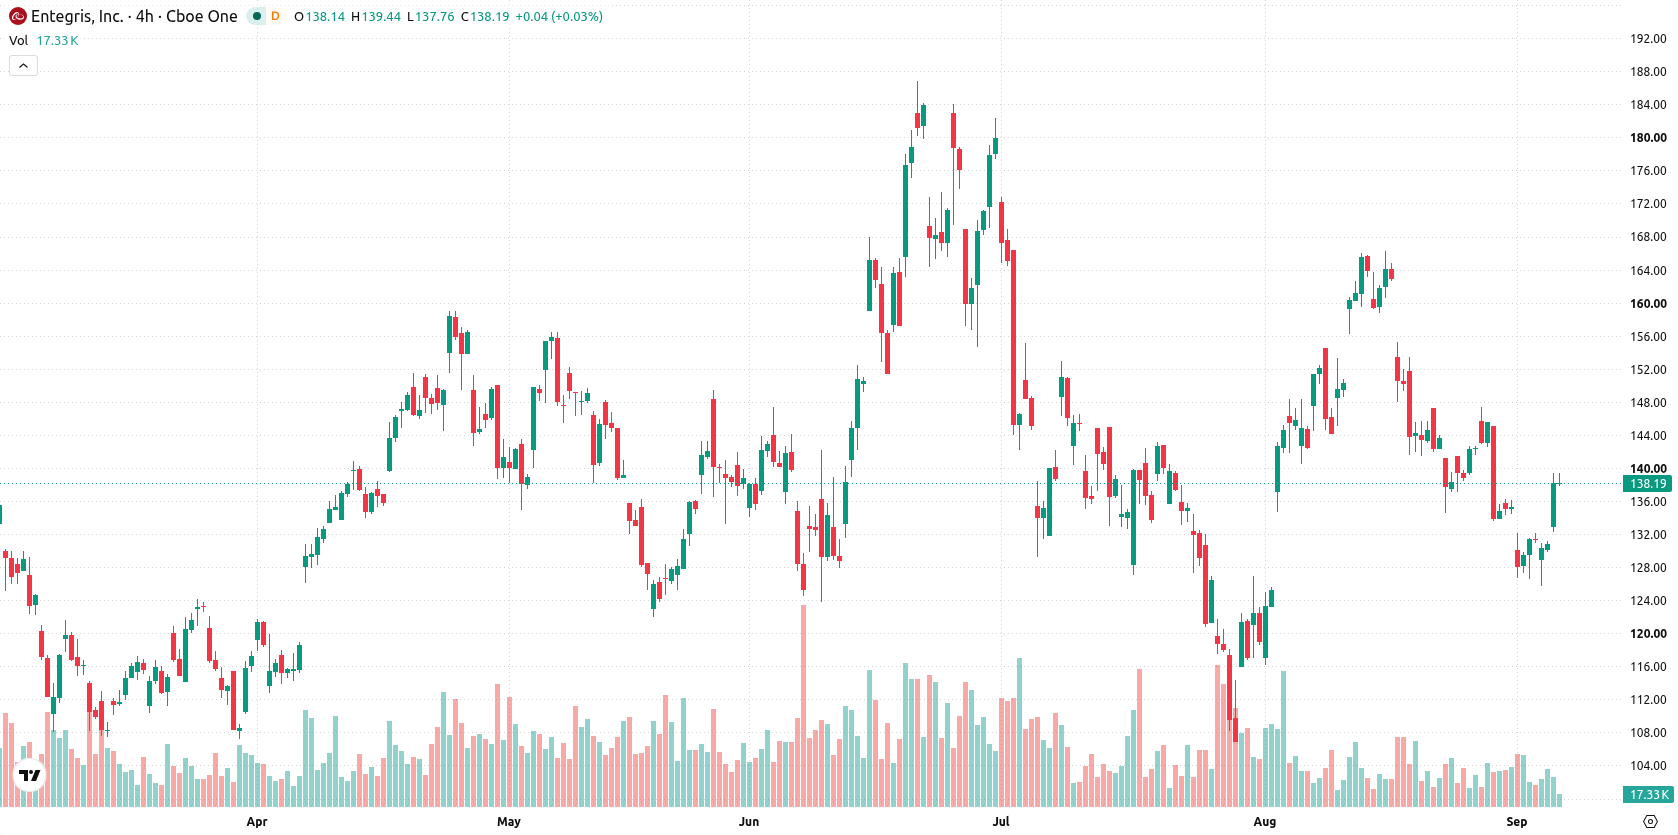
Entegris Inc (ENTG) surged 5.75% as buyers stepped in amid oversold technical signals and a strong intraday rebound. The move remains limited, with the stock still trading below both its 20-day and 50-day moving averages.
 161.00
170.23
Highlights
- Entegris stock trades below its 20-day and 50-day moving averages, indicating ongoing short- and medium-term selling pressure.
- Momentum indicators show predominantly negative signals, with the stock nearing oversold conditions and sellers controlling intraday trading.
- Shares of Entegris are projected to move between $133.03 and $147.32 over the next five days, with a 71% probability of a downward move.
Short-term selling pressure persists as bullish long-term structure diverges from negative momentum
Entegris is trading below both its 20-day and 50-day moving averages ($145.3 and $142.55, respectively), but remains above the 200-day moving average at $125.85. This setup signals lingering short-term and medium-term pressure from sellers, with the long-term trend still supported by a bullish alignment between the 50-day and 200-day moving averages. Resistance is seen at the near-term ceiling of $139.44, and support at the near-term floor of $136.14. Momentum signals are mixed: the MACD suggests further downside pressure and the ADX reads as neutral. Both the RSI at 41.71 and CCI at -126.68 indicate the stock is approaching oversold territory, confirmed by the Stochastic RSI of 5.59. Bull/Bear Power at -6.89 shows sellers are dominating intraday action, now in oversold conditions. The Awesome Oscillator reinforces the prevailing selling momentum. The price sits near the day's high on robust intraday volatility of 5.36%. The stock shows strength toward session highs, but momentum signals remain overall negative, marking a clear divergence between price action and underlying sentiment.
Earlier, analysts noted that Entegris faced persistent selling pressure and mixed technical readings, which signaled ongoing short- and medium-term downside risk despite longer-term support. The latest price rebound occurs within a context of oversold technical conditions, and traders should monitor a potential volatility-driven move outside the current $133.03–$147.32 band for the next directional signal.






Latest Entegris Inc News




-
 Afghanistan
-
 Albania
-
 Algeria
-
 Angola
-
 Argentina
-
 Armenia
-
 Australia
-
 Austria
-
 Azerbaijan
-
 Bahamas
-
 Bahrain
-
 Bangladesh
-
 Belarus
-
 Belgium
-
 Bolivia
-
 Botswana
-
 Brazil
-
 Brunei
-
 Bulgaria
-
 Cambodia
-
 Cameroon
-
 Canada
-
 Chile
-
 China
-
 Colombia
-
 Congo
-
 Costa Rica
-
 Cote d'Ivoire
-
 Croatia
-
 Cuba
-
 Cyprus
-
 Czechia
-
 DR Congo
-
 Denmark
-
 Dominican Republic
-
 Ecuador
-
 Egypt
-
 El Salvador
-
 Estonia
-
 Eswatini
-
 Ethiopia
-
 Finland
-
 France
-
 Georgia
-
 Germany
-
 Ghana
-
 Greece
-
 Haiti
-
 Hong Kong
-
 Hungary
-
 India
-
 Indonesia
-
 Iran, Islamic republic
-
 Iraq
-
 Ireland
-
 Israel
-
 Italy
-
 Jamaica
-
 Japan
-
 Jordan
-
 Kazakhstan
-
 Kenya
-
 Korea
-
 Kuwait
-
 Kyrgyzstan
-
 Laos
-
 Latvia
-
 Lebanon
-
 Lesotho
-
 Libya
-
 Lithuania
-
 Luxembourg
-
 Madagascar
-
 Malaysia
-
 Malta
-
 Mauritius
-
 Mexico
-
 Moldova
-
 Mongolia
-
 Montenegro
-
 Morocco
-
 Mozambique
-
 Myanmar
-
 Namibia
-
 Nepal
-
 Netherlands
-
 New Zealand
-
 Nigeria
-
 North Macedonia
-
 Norway
-
 Oman
-
 Pakistan
-
 Palestine
-
 Panama
-
 Papua New Guinea
-
 Paraguay
-
 Peru
-
 Philippines
-
 Poland
-
 Portugal
-
 Puerto Rico
-
 Qatar
-
 Reunion
-
 Romania
-
 Rwanda
-
 Saudi Arabia
-
 Serbia
-
 Singapore
-
 Slovakia
-
 Slovenia
-
 Somalia
-
 South Africa
-
 Spain
-
 Sri Lanka
-
 Sweden
-
 Switzerland
-
 Syria
-
 Taiwan
-
 Tajikistan
-
 Tanzania
-
 Thailand
-
 Trinidad and Tobago
-
 Tunisia
-
 Turkey
-
 UAE
-
 Uganda
-
 Ukraine
-
 United Kingdom
-
United States
-
 Uruguay
-
 Uzbekistan
-
 Venezuela
-
 Vietnam
-
 Yemen
-
 Zambia
-
 Zimbabwe
- Forex
- Crypto












