

Visa stock weekly forecast: Consistent dividend growth supports sentiment amid overbought signals

Shares of Visa Inc. (V) are trading near $375 after slipping nearly 2% over the past week as the recovery extended but momentum began to turn cautious. The main focus for the week ahead is the risk of overbought conditions giving way to further softness, with chart signals starting to diverge.
 416.34
411.88
Highlights
- Shares of Visa declined 1.81% over the past week, closing at $375 and remaining above key trend levels.
- Technical momentum signals are mixed, with diverging indicators suggesting early signs of a potential move lower.
- Next week, Visa stock is expected to trade in a $368.55 to $379.35 range, with key support at $372.36 and resistance at $382.09.
Dividend growth streak and market share reinforce sentiment for the week
A recent analysis by The Motley Fool highlighted that V has increased its dividend for 18 consecutive years, with the yield now at 0.71% and a total increase of 2,450% since its 2008 IPO. Emphasis was placed on V's durable competitive position in payments and its consistent track record of growing shareholder returns via dividend growth. These factors are likely to underpin sentiment for the stock in the coming week.
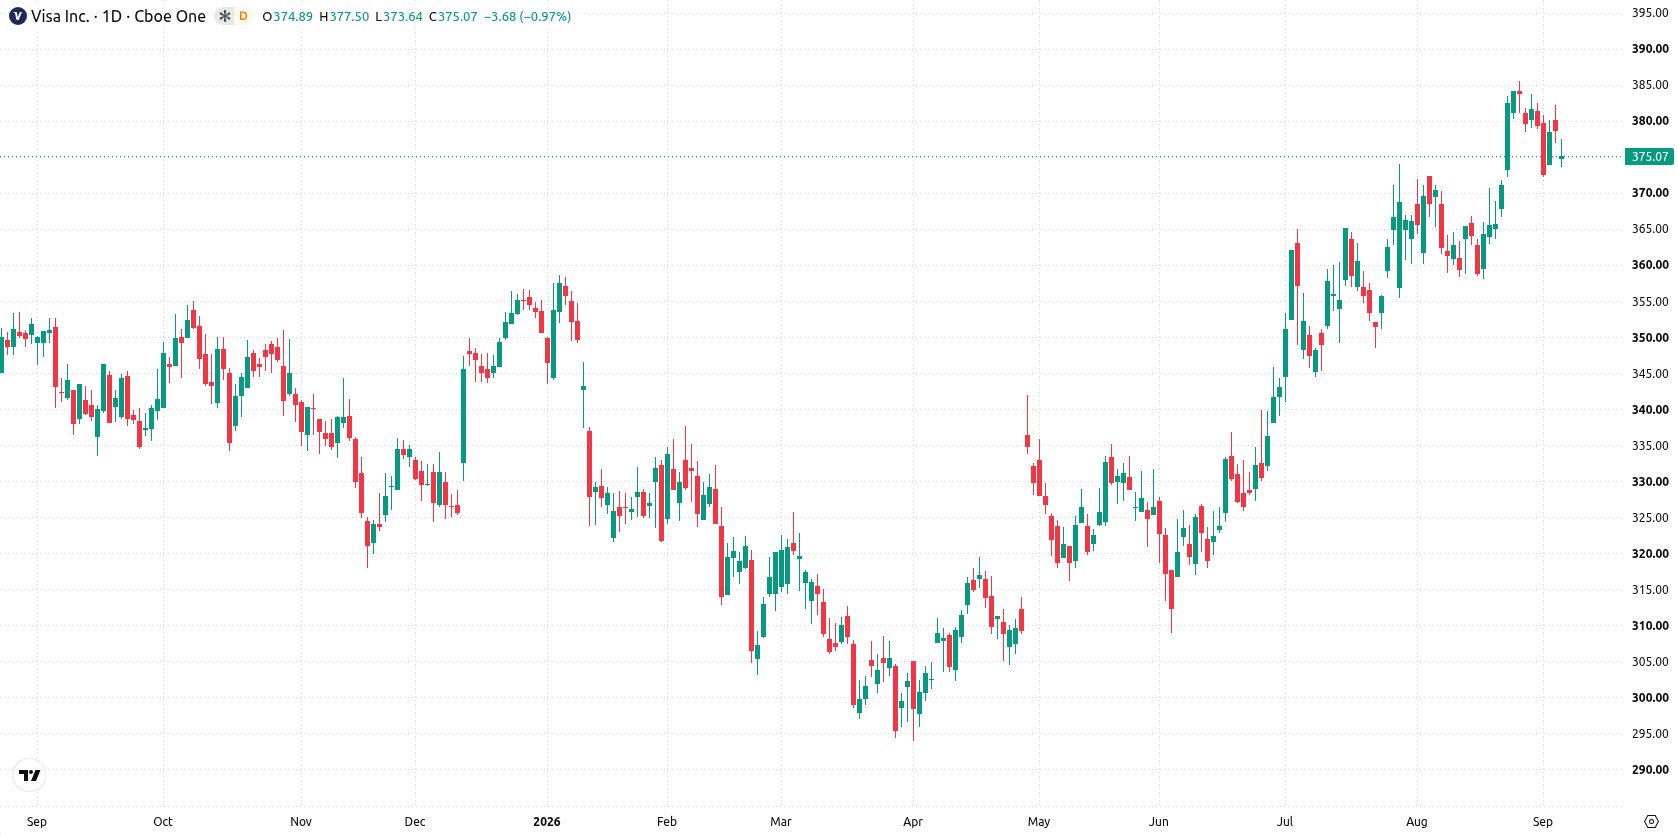
Momentum divergence signals potential reversal as overbought fades
On the daily chart, the structure is constructive but showing early signs of softening, as momentum signals diverge. Bull/Bear Power reads as overbought at 1.33 while Stochastic RSI has entered oversold territory at 0, and the MACD remains positive with a "Strong Buy" bias. The nearest support is $372.36, underpinned by the Ichimoku Kijun at $371.76, while resistance stands at $382.09. With volatility at 2.61% and a developing trend strength, the momentum character points to an emerging move lower that is not yet confirmed.
Bullish breakout risk rises as support and resistance are tested next week
Next week, the expected range is $368.55 to $379.35, with a 71% probability of an increase and a 29% probability of a decrease. The base case sees the stock trading between support at $372.36 and resistance at $382.09. A bullish breakout above $382.09 could open room for further gains, while a breakdown below $372.36 would confirm bearish momentum and risk tests of the lower boundary at $368.55.
Earlier, analysts noted that Visa's strong fundamentals and resilient business lines positioned it favorably, but flagged elevated overbought technical signals as a potential cause for near-term caution. The latest signals of diverging momentum, combined with ongoing support from dividend growth, raise the importance of monitoring the $372.36 support level as a confirmation point for a possible shift lower.











-
 Afghanistan
-
 Albania
-
 Algeria
-
 Angola
-
 Argentina
-
 Armenia
-
 Australia
-
 Austria
-
 Azerbaijan
-
 Bahamas
-
 Bahrain
-
 Bangladesh
-
 Belarus
-
 Belgium
-
 Bolivia
-
 Botswana
-
 Brazil
-
 Brunei
-
 Bulgaria
-
 Cambodia
-
 Cameroon
-
 Canada
-
 Chile
-
 China
-
 Colombia
-
 Congo
-
 Costa Rica
-
 Cote d'Ivoire
-
 Croatia
-
 Cuba
-
 Cyprus
-
 Czechia
-
 DR Congo
-
 Denmark
-
 Dominican Republic
-
 Ecuador
-
 Egypt
-
 El Salvador
-
 Estonia
-
 Eswatini
-
 Ethiopia
-
 Finland
-
 France
-
 Georgia
-
 Germany
-
 Ghana
-
 Greece
-
 Haiti
-
 Hong Kong
-
 Hungary
-
 India
-
 Indonesia
-
 Iran, Islamic republic
-
 Iraq
-
 Ireland
-
 Israel
-
 Italy
-
 Jamaica
-
 Japan
-
 Jordan
-
 Kazakhstan
-
 Kenya
-
 Korea
-
 Kuwait
-
 Kyrgyzstan
-
 Laos
-
 Latvia
-
 Lebanon
-
 Lesotho
-
 Libya
-
 Lithuania
-
 Luxembourg
-
 Madagascar
-
 Malaysia
-
 Malta
-
 Mauritius
-
 Mexico
-
 Moldova
-
 Mongolia
-
 Montenegro
-
 Morocco
-
 Mozambique
-
 Myanmar
-
 Namibia
-
 Nepal
-
 Netherlands
-
 New Zealand
-
 Nigeria
-
 North Macedonia
-
 Norway
-
 Oman
-
 Pakistan
-
 Palestine
-
 Panama
-
 Papua New Guinea
-
 Paraguay
-
 Peru
-
 Philippines
-
 Poland
-
 Portugal
-
 Puerto Rico
-
 Qatar
-
 Reunion
-
 Romania
-
 Rwanda
-
 Saudi Arabia
-
 Serbia
-
 Singapore
-
 Slovakia
-
 Slovenia
-
 Somalia
-
 South Africa
-
 Spain
-
 Sri Lanka
-
 Sweden
-
 Switzerland
-
 Syria
-
 Taiwan
-
 Tajikistan
-
 Tanzania
-
 Thailand
-
 Trinidad and Tobago
-
 Tunisia
-
 Turkey
-
 UAE
-
 Uganda
-
 Ukraine
-
 United Kingdom
-
United States
-
 Uruguay
-
 Uzbekistan
-
 Venezuela
-
 Vietnam
-
 Yemen
-
 Zambia
-
 Zimbabwe
- Forex
- Crypto












