

Can Uber stock hold support after ride-hailing shutdown in Nigeria and Uganda?

Uber Technologies, Inc. (UBER) stock is trading at $75.76 after a marginal decline today, sliding within a narrow daily range. The price remains below its key moving averages, signaling ongoing pressure on both short- and long-term timeframes.
 65.80
66.82
Highlights
- Uber completed its first multi-tranche euro bond deal to expand funding options and increase liquidity for future growth.
- The boards of Delivery Hero backed Uber's takeover offer, advancing a major acquisition that still requires regulatory and shareholder clearance.
- Shares of Uber remain under broad selling pressure, trading below key moving averages with bearish technical signals and likely to range from $74.11 to $77.41.
Funding access expands as strategic overhaul heightens operational uncertainty
Uber completed its debut multi-tranche euro bond offering, broadening its funding access and enhancing liquidity for future expansion, according to Bloomberg. The management and supervisory boards of Delivery Hero have formally supported Uber’s takeover offer, indicating progress toward a major acquisition although the deal still awaits regulatory and shareholder approval. Meanwhile, the company recently ceased ride-hailing services in Nigeria and Uganda as part of ongoing restructuring, and faces an investigation by Nigeria’s antitrust commission following its exit. These developments reflect a period of operational adjustment and strategic repositioning, though price action has remained under broader selling pressure.
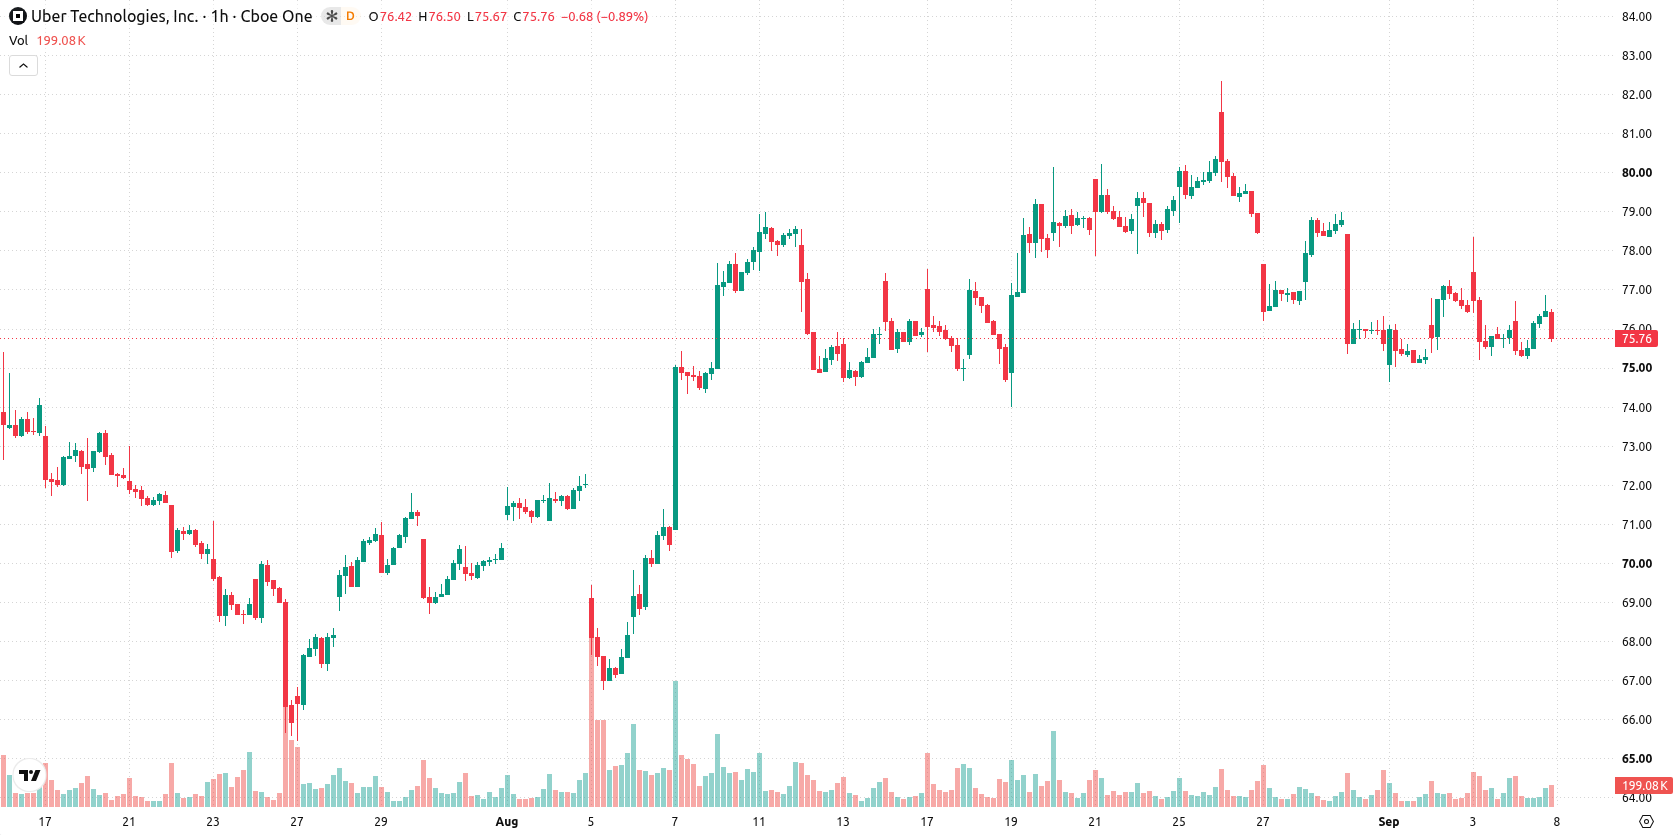
Bearish momentum aligns across indicators as resistance holds
On the daily chart, UBER remains below the 20-period, 50-period, and 200-period moving averages, while the Ichimoku Kijun sits at $76.72 and acts as immediate resistance. Over the session, momentum signals from MACD flash strong sell and RSI shows 45.53 with a sell reading, while Stoch RSI also indicates strong sell. CCI and ADX are neutral, but Bull/Bear Power tips slightly in favor of buyers intraday. Notably, Awesome Oscillator diverges with a strong buy signal against the general bearish bias of other indicators.
Bearish continuation likely as breakout risks shift to downside
In the short term, UBER is expected to fluctuate between support at $74.11 and resistance near $77.41 under typical volatility conditions. The probability of an upward move remains very low, with a very high likelihood of downside continuation. The baseline scenario envisions price trading within this defined range; a decisive break above $76.72 would be required to shift toward a bullish scenario, while a drop below $74.11 would reinforce a bearish continuation.
Earlier, analysts noted that Uber was navigating heightened uncertainty amid restructuring, legal pressures, and mixed technical signals. The current setup reinforces this view as fresh corporate actions and indicator divergences maintain volatility, making a sustained move above $76.72 or below $74.11 the key triggers to watch for signs of a directional breakout.









-
 Afghanistan
-
 Albania
-
 Algeria
-
 Angola
-
 Argentina
-
 Armenia
-
 Australia
-
 Austria
-
 Azerbaijan
-
 Bahamas
-
 Bahrain
-
 Bangladesh
-
 Belarus
-
 Belgium
-
 Bolivia
-
 Botswana
-
 Brazil
-
 Brunei
-
 Bulgaria
-
 Cambodia
-
 Cameroon
-
 Canada
-
 Chile
-
 China
-
 Colombia
-
 Congo
-
 Costa Rica
-
 Cote d'Ivoire
-
 Croatia
-
 Cuba
-
 Cyprus
-
 Czechia
-
 DR Congo
-
 Denmark
-
 Dominican Republic
-
 Ecuador
-
 Egypt
-
 El Salvador
-
 Estonia
-
 Eswatini
-
 Ethiopia
-
 Finland
-
 France
-
 Georgia
-
 Germany
-
 Ghana
-
 Greece
-
 Haiti
-
 Hong Kong
-
 Hungary
-
 India
-
 Indonesia
-
 Iran, Islamic republic
-
 Iraq
-
 Ireland
-
 Israel
-
 Italy
-
 Jamaica
-
 Japan
-
 Jordan
-
 Kazakhstan
-
 Kenya
-
 Korea
-
 Kuwait
-
 Kyrgyzstan
-
 Laos
-
 Latvia
-
 Lebanon
-
 Lesotho
-
 Libya
-
 Lithuania
-
 Luxembourg
-
 Madagascar
-
 Malaysia
-
 Malta
-
 Mauritius
-
 Mexico
-
 Moldova
-
 Mongolia
-
 Montenegro
-
 Morocco
-
 Mozambique
-
 Myanmar
-
 Namibia
-
 Nepal
-
 Netherlands
-
 New Zealand
-
 Nigeria
-
 North Macedonia
-
 Norway
-
 Oman
-
 Pakistan
-
 Palestine
-
 Panama
-
 Papua New Guinea
-
 Paraguay
-
 Peru
-
 Philippines
-
 Poland
-
 Portugal
-
 Puerto Rico
-
 Qatar
-
 Reunion
-
 Romania
-
 Rwanda
-
 Saudi Arabia
-
 Serbia
-
 Singapore
-
 Slovakia
-
 Slovenia
-
 Somalia
-
 South Africa
-
 Spain
-
 Sri Lanka
-
 Sweden
-
 Switzerland
-
 Syria
-
 Taiwan
-
 Tajikistan
-
 Tanzania
-
 Thailand
-
 Trinidad and Tobago
-
 Tunisia
-
 Turkey
-
 UAE
-
 Uganda
-
 Ukraine
-
 United Kingdom
-
United States
-
 Uruguay
-
 Uzbekistan
-
 Venezuela
-
 Vietnam
-
 Yemen
-
 Zambia
-
 Zimbabwe
- Forex
- Crypto












