

What's behind Nano Dimension's latest 3.1% stock pullback?

Nano Dimension Ltd (NNDM) fell 3.1% today under continued short-term selling pressure and a lack of fresh catalysts. The downside move is supported by bearish momentum, with the stock trading below its 20- and 200-day moving averages and remaining under near-term resistance.
 1.28
1.38
Highlights
- Nano Dimension stock trades below key 20-day and 200-day moving averages, signaling a bearish long-term trend.
- Technical signals are mixed, with positive momentum offset by overbought conditions and weak trend confirmation.
- Expected five-day price range is $1.54 to $1.62, with a high probability of continued sideways movement near current levels.
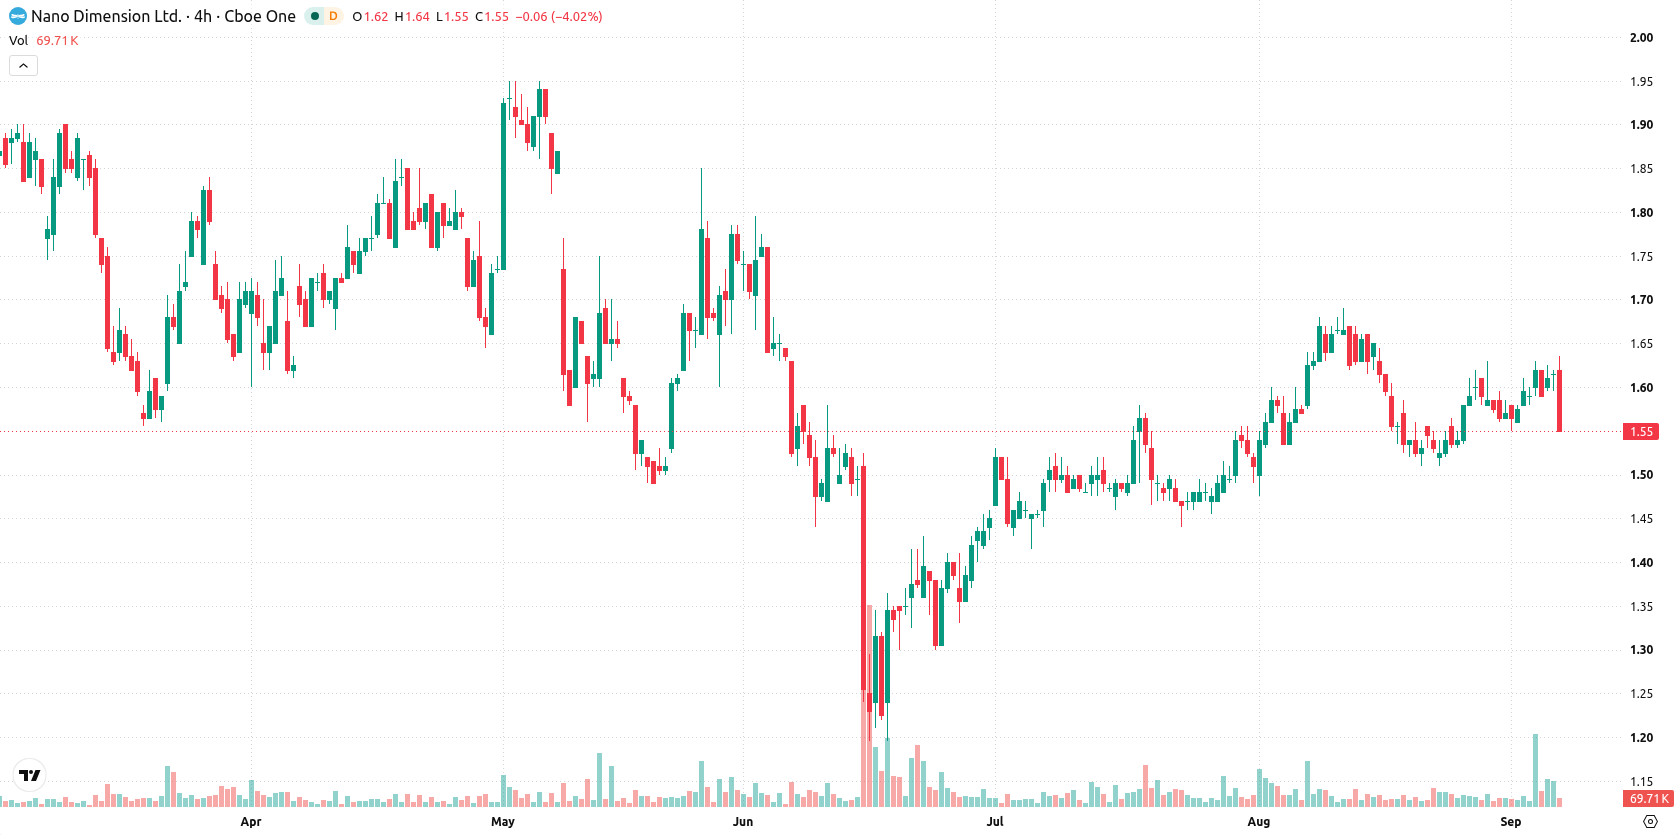
Mixed momentum and overbought warnings as trend boundaries tighten
Nano Dimension is trading below its 20-day moving average at $1.59 and the 200-day moving average at $1.67, while remaining above the 50-day moving average at $1.53. This setup indicates some short-term selling pressure, medium-term stability, and an overall bearish long-term trend, with the near-term ceiling at $1.58 and support at $1.54. Momentum signals are mixed: the Moving Average Convergence Divergence (MACD) suggests modest buying strength, but the Average Directional Index (ADX) at 6.65 reflects a weak or directionless trend. The Relative Strength Index (RSI) at 57.56 leans bullish, but the Stochastic RSI is at 100 and flagged as overbought, while the Commodity Channel Index (CCI) remains neutral. Bull/Bear Power (BBP) is positive, indicating buyers dominate intraday momentum, yet the overbought condition warns of possible exhaustion. The Awesome Oscillator is neutral and does not impact trend confirmation. The stock has slipped $0.05 or 3.1% today, opening with a downside gap of about $0.02 (−1.23%), and currently trades near the session low. Intraday volatility stands at 1.89%, with ongoing pressure after the open. Some divergence exists between positive momentum and overbought oscillators.
Earlier, analysts noted that Nano Dimension was exhibiting a broadly sideways trend with potential for directional movement pending a clear breakout or breakdown. The latest market action confirms this indecisive setup, with a potential shift in the coming days hinging on whether the stock can sustain levels above $1.62 to trigger a breakout, or falls below $1.54 to signal renewed downside risk.






Latest Nano Dimension News




-
 Afghanistan
-
 Albania
-
 Algeria
-
 Angola
-
 Argentina
-
 Armenia
-
 Australia
-
 Austria
-
 Azerbaijan
-
 Bahamas
-
 Bahrain
-
 Bangladesh
-
 Belarus
-
 Belgium
-
 Bolivia
-
 Botswana
-
 Brazil
-
 Brunei
-
 Bulgaria
-
 Cambodia
-
 Cameroon
-
 Canada
-
 Chile
-
 China
-
 Colombia
-
 Congo
-
 Costa Rica
-
 Cote d'Ivoire
-
 Croatia
-
 Cuba
-
 Cyprus
-
 Czechia
-
 DR Congo
-
 Denmark
-
 Dominican Republic
-
 Ecuador
-
 Egypt
-
 El Salvador
-
 Estonia
-
 Eswatini
-
 Ethiopia
-
 Finland
-
 France
-
 Georgia
-
 Germany
-
 Ghana
-
 Greece
-
 Haiti
-
 Hong Kong
-
 Hungary
-
 India
-
 Indonesia
-
 Iran, Islamic republic
-
 Iraq
-
 Ireland
-
 Israel
-
 Italy
-
 Jamaica
-
 Japan
-
 Jordan
-
 Kazakhstan
-
 Kenya
-
 Korea
-
 Kuwait
-
 Kyrgyzstan
-
 Laos
-
 Latvia
-
 Lebanon
-
 Lesotho
-
 Libya
-
 Lithuania
-
 Luxembourg
-
 Madagascar
-
 Malaysia
-
 Malta
-
 Mauritius
-
 Mexico
-
 Moldova
-
 Mongolia
-
 Montenegro
-
 Morocco
-
 Mozambique
-
 Myanmar
-
 Namibia
-
 Nepal
-
 Netherlands
-
 New Zealand
-
 Nigeria
-
 North Macedonia
-
 Norway
-
 Oman
-
 Pakistan
-
 Palestine
-
 Panama
-
 Papua New Guinea
-
 Paraguay
-
 Peru
-
 Philippines
-
 Poland
-
 Portugal
-
 Puerto Rico
-
 Qatar
-
 Reunion
-
 Romania
-
 Rwanda
-
 Saudi Arabia
-
 Serbia
-
 Singapore
-
 Slovakia
-
 Slovenia
-
 Somalia
-
 South Africa
-
 Spain
-
 Sri Lanka
-
 Sweden
-
 Switzerland
-
 Syria
-
 Taiwan
-
 Tajikistan
-
 Tanzania
-
 Thailand
-
 Trinidad and Tobago
-
 Tunisia
-
 Turkey
-
 UAE
-
 Uganda
-
 Ukraine
-
 United Kingdom
-
United States
-
 Uruguay
-
 Uzbekistan
-
 Venezuela
-
 Vietnam
-
 Yemen
-
 Zambia
-
 Zimbabwe
- Forex
- Crypto












