

Costco stock weekly forecast: Downside risk persists amid MACD sell setup

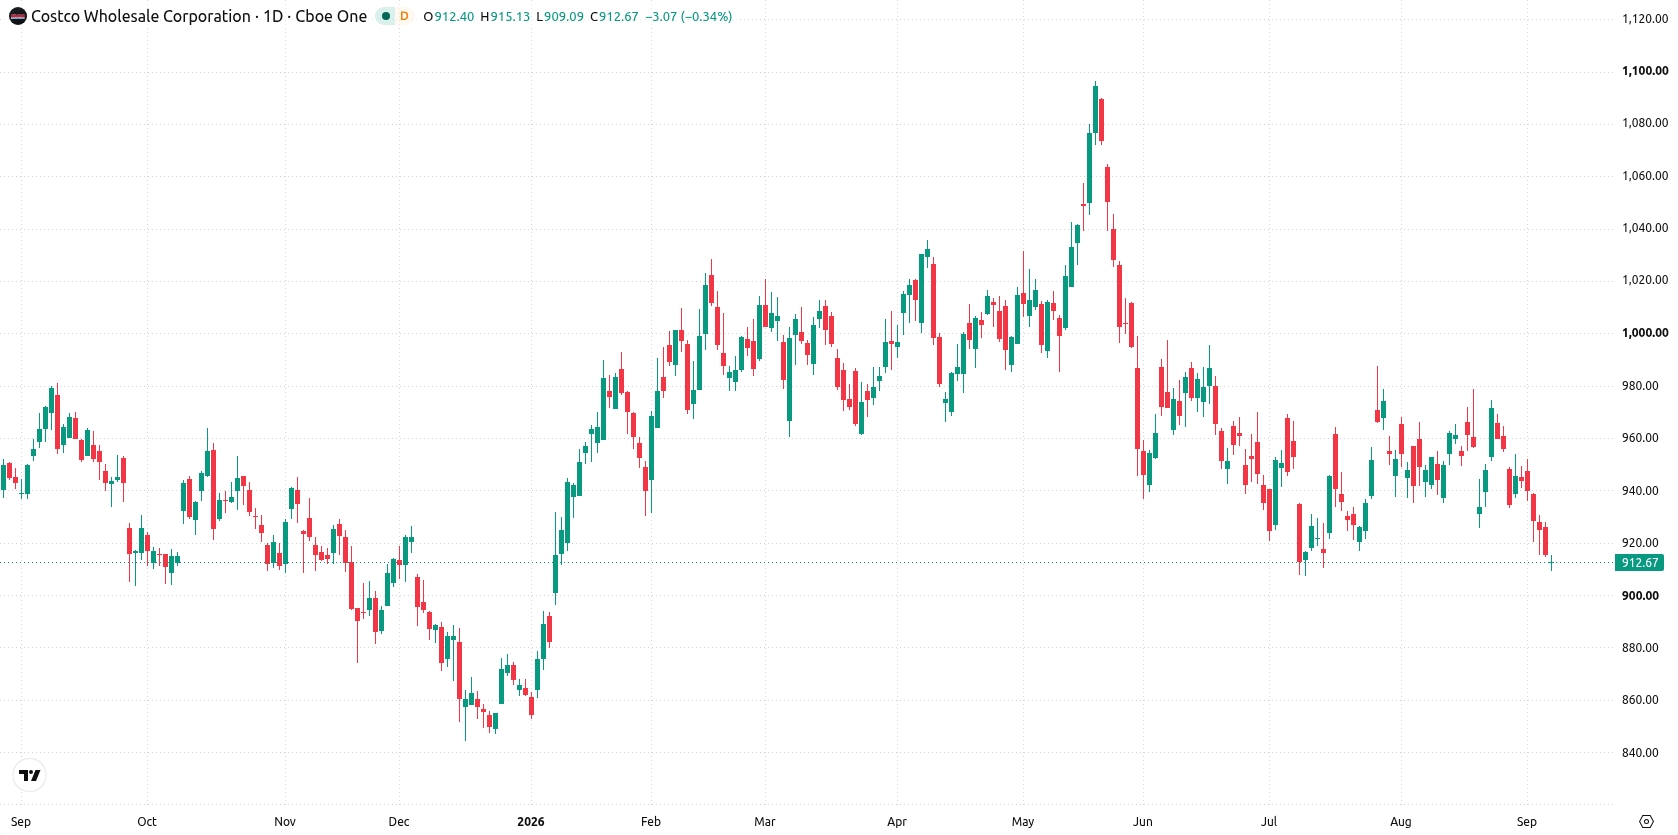
Shares of Costco Wholesale Corporation (COST) are trading near $912 as a slow decline has pushed the stock deeper into technically oversold territory. Pressure remains for the coming week as buyers watch for signs of stabilization after the latest stretch lower.
 1021.17
Highlights
- Shares of Costco closed at $912.39, trading narrowly lower over the past week and below key moving averages.
- Technical indicators show a bearish long-term structure with momentum oscillators indicating oversold conditions and continued consolidation.
- Shares are expected to trade between $903.02 and $937.89 next week, with resistance at $914.6 and downside risk prevailing if that level is not reclaimed.
Earnings momentum and premium valuation sustain bullish sentiment this week
According to Yahoo Finance, Costco reported August 2026 sales rose 9.9% year-over-year, highlighting strong demand driven by robust U.S. performance and record digital growth. Yahoo Finance also noted the company continues to trade at elevated earnings multiples, reflecting its premium status among warehouse retailers. The Motley Fool reported that Costco has raised its dividend annually since 2004 and continues to register steady membership growth, while TheStreet said the company recently closed its Costco Next marketplace.
Consolidation bias dominates as key indicators reinforce downside risk
On the daily chart, the setup shows a contained move within a narrow range, with volatility at 2.29%. Key signals include the RSI approaching oversold at 38.07 and the Stochastic RSI deep in the oversold zone, while MACD remains in a sell configuration. Immediate resistance aligns with $914.6, which acts as both the lower weekly boundary and current resistance, while the Ichimoku Kijun at $946.65 reinforces overhead barriers. The bias is for continued consolidation, with downside risk predominating if price fails to reclaim resistance levels.
Bearish outlook persists as high downside probability shapes next week’s range
Over the coming trading week, the expected range is $903.02 to $937.89. There is a very high probability (more than 80%) of a decrease and a very low probability (less than 20%) of an increase. The base case is for shares to consolidate within this range, stalling near resistance at $914.6. A move above $914.6 could prompt a test towards $937.89, while any decisive break below $903.02 would signal further downside.
Earlier, analysts noted that broader equity market moves and sector shifts continued to reflect the influence of macroeconomic data and changing bond yields. In the case of Costco, technical pressures and persistent oversold signals point to a prevailing scenario of consolidation, with downside risk predominating if the price fails to reclaim resistance at $914.6.











-
 Afghanistan
-
 Albania
-
 Algeria
-
 Angola
-
 Argentina
-
 Armenia
-
 Australia
-
 Austria
-
 Azerbaijan
-
 Bahamas
-
 Bahrain
-
 Bangladesh
-
 Belarus
-
 Belgium
-
 Bolivia
-
 Botswana
-
 Brazil
-
 Brunei
-
 Bulgaria
-
 Cambodia
-
 Cameroon
-
 Canada
-
 Chile
-
 China
-
 Colombia
-
 Congo
-
 Costa Rica
-
 Cote d'Ivoire
-
 Croatia
-
 Cuba
-
 Cyprus
-
 Czechia
-
 DR Congo
-
 Denmark
-
 Dominican Republic
-
 Ecuador
-
 Egypt
-
 El Salvador
-
 Estonia
-
 Eswatini
-
 Ethiopia
-
 Finland
-
 France
-
 Georgia
-
 Germany
-
 Ghana
-
 Greece
-
 Haiti
-
 Hong Kong
-
 Hungary
-
 India
-
 Indonesia
-
 Iran, Islamic republic
-
 Iraq
-
 Ireland
-
 Israel
-
 Italy
-
 Jamaica
-
 Japan
-
 Jordan
-
 Kazakhstan
-
 Kenya
-
 Korea
-
 Kuwait
-
 Kyrgyzstan
-
 Laos
-
 Latvia
-
 Lebanon
-
 Lesotho
-
 Libya
-
 Lithuania
-
 Luxembourg
-
 Madagascar
-
 Malaysia
-
 Malta
-
 Mauritius
-
 Mexico
-
 Moldova
-
 Mongolia
-
 Montenegro
-
 Morocco
-
 Mozambique
-
 Myanmar
-
 Namibia
-
 Nepal
-
 Netherlands
-
 New Zealand
-
 Nigeria
-
 North Macedonia
-
 Norway
-
 Oman
-
 Pakistan
-
 Palestine
-
 Panama
-
 Papua New Guinea
-
 Paraguay
-
 Peru
-
 Philippines
-
 Poland
-
 Portugal
-
 Puerto Rico
-
 Qatar
-
 Reunion
-
 Romania
-
 Rwanda
-
 Saudi Arabia
-
 Serbia
-
 Singapore
-
 Slovakia
-
 Slovenia
-
 Somalia
-
 South Africa
-
 Spain
-
 Sri Lanka
-
 Sweden
-
 Switzerland
-
 Syria
-
 Taiwan
-
 Tajikistan
-
 Tanzania
-
 Thailand
-
 Trinidad and Tobago
-
 Tunisia
-
 Turkey
-
 UAE
-
 Uganda
-
 Ukraine
-
 United Kingdom
-
United States
-
 Uruguay
-
 Uzbekistan
-
 Venezuela
-
 Vietnam
-
 Yemen
-
 Zambia
-
 Zimbabwe
- Forex
- Crypto












