

Lucid Group stock outlook: Cash burn eclipses strong revenue growth

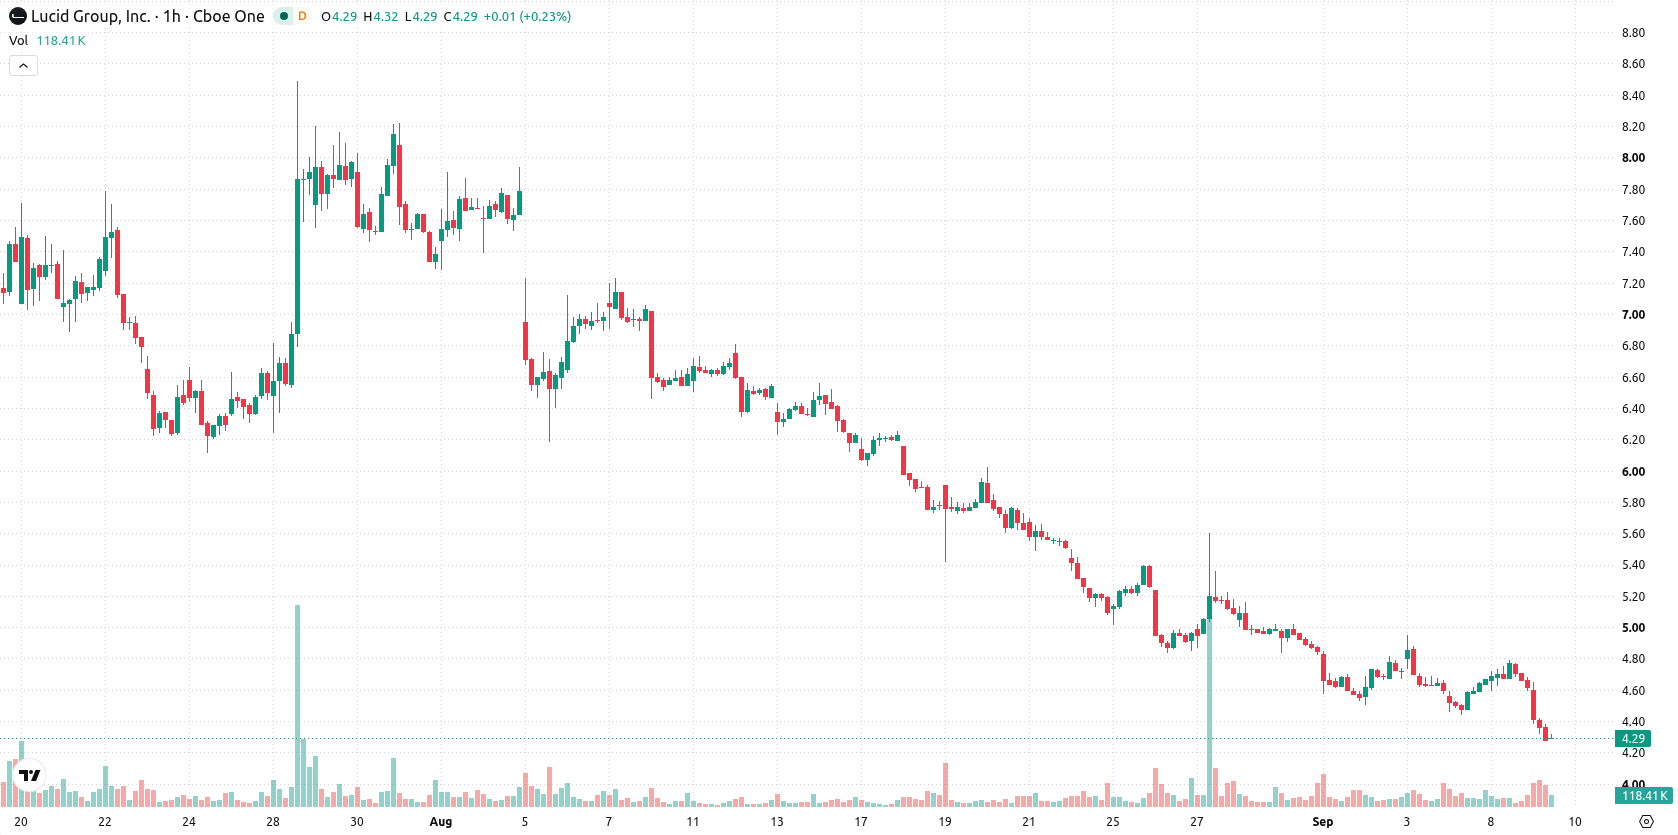
Lucid Group (LCID) stock is trading at $4.31 after a decline of 7.02% on the day. The price remains below its key moving averages.
 3.11
3.59
Highlights
- Lucid Group reported a 56% year-over-year revenue increase, with vehicle production up 24% and deliveries up 19%.
- Quarterly cash burn accelerated to $1.5 billion, raising concerns about long-term liquidity despite operating growth.
- Shares of Lucid stock closed at $4.31 after a 7.02% decline, with technical signals indicating strong selling pressure and a likely short-term range of $3.98 to $4.5.
Liquidity worries intensify despite higher revenue and production
Lucid Group recently released financial results showing a 56% year-over-year revenue increase, accompanied by a 24% rise in vehicle production and a 19% uptick in deliveries, according to The Motley Fool. While these operating improvements highlight progress in expanding the business, the same results revealed an accelerated quarterly cash burn of about $1.5 billion. The surge in spending has heightened concerns about long-term liquidity, influencing sentiment despite top-line growth.
Downward momentum persists as technical indicators confirm selling bias
On the H1 chart, LCID is trading below its MA-20 at $4.61 and MA-50 at $4.72, and remains well under the MA-200 at $8.43. Immediate resistance is marked by the Ichimoku Kijun at $4.64. Momentum signals continue to support selling: MACD shows a Sell signal, RSI is at 31.34 (Sell), Stochastic RSI and CCI both register Oversold, and Bull/Bear Power indicates sellers are dominating. ADX reads as Neutral, and the Awesome Oscillator presents a Strong Sell, confirming pronounced downward momentum with no divergence detected among the oscillators.
Limited rebound prospects as volatility narrows and downside risk grows
In the near term, LCID is likely to trade within the $3.98–$4.5 volatility band relative to current levels. Most scenarios favor further downside, while a break below $3.98 could accelerate losses. A bullish reversal would require a decisive move above the $4.64 resistance, but with downward momentum dominating, the probability of sustained recovery remains low.
Earlier, analysts noted that Lucid Group continued to face persistent bearish momentum and operational headwinds, with technical factors pointing to sustained downside risk. The latest financial and technical data reinforce this view, highlighting that traders should monitor the $3.98 support level as a potential trigger for accelerated downside if breached.










-
 Afghanistan
-
 Albania
-
 Algeria
-
 Angola
-
 Argentina
-
 Armenia
-
 Australia
-
 Austria
-
 Azerbaijan
-
 Bahamas
-
 Bahrain
-
 Bangladesh
-
 Belarus
-
 Belgium
-
 Bolivia
-
 Botswana
-
 Brazil
-
 Brunei
-
 Bulgaria
-
 Cambodia
-
 Cameroon
-
 Canada
-
 Chile
-
 China
-
 Colombia
-
 Congo
-
 Costa Rica
-
 Cote d'Ivoire
-
 Croatia
-
 Cuba
-
 Cyprus
-
 Czechia
-
 DR Congo
-
 Denmark
-
 Dominican Republic
-
 Ecuador
-
 Egypt
-
 El Salvador
-
 Estonia
-
 Eswatini
-
 Ethiopia
-
 Finland
-
 France
-
 Georgia
-
 Germany
-
 Ghana
-
 Greece
-
 Haiti
-
 Hong Kong
-
 Hungary
-
 India
-
 Indonesia
-
 Iran, Islamic republic
-
 Iraq
-
 Ireland
-
 Israel
-
 Italy
-
 Jamaica
-
 Japan
-
 Jordan
-
 Kazakhstan
-
 Kenya
-
 Korea
-
 Kuwait
-
 Kyrgyzstan
-
 Laos
-
 Latvia
-
 Lebanon
-
 Lesotho
-
 Libya
-
 Lithuania
-
 Luxembourg
-
 Madagascar
-
 Malaysia
-
 Malta
-
 Mauritius
-
 Mexico
-
 Moldova
-
 Mongolia
-
 Montenegro
-
 Morocco
-
 Mozambique
-
 Myanmar
-
 Namibia
-
 Nepal
-
 Netherlands
-
 New Zealand
-
 Nigeria
-
 North Macedonia
-
 Norway
-
 Oman
-
 Pakistan
-
 Palestine
-
 Panama
-
 Papua New Guinea
-
 Paraguay
-
 Peru
-
 Philippines
-
 Poland
-
 Portugal
-
 Puerto Rico
-
 Qatar
-
 Reunion
-
 Romania
-
 Rwanda
-
 Saudi Arabia
-
 Serbia
-
 Singapore
-
 Slovakia
-
 Slovenia
-
 Somalia
-
 South Africa
-
 Spain
-
 Sri Lanka
-
 Sweden
-
 Switzerland
-
 Syria
-
 Taiwan
-
 Tajikistan
-
 Tanzania
-
 Thailand
-
 Trinidad and Tobago
-
 Tunisia
-
 Turkey
-
 UAE
-
 Uganda
-
 Ukraine
-
 United Kingdom
-
United States
-
 Uruguay
-
 Uzbekistan
-
 Venezuela
-
 Vietnam
-
 Yemen
-
 Zambia
-
 Zimbabwe
- Forex
- Crypto












