

Axon stock outlook: Weak momentum puts pressure on near-term performance

Axon (AXON) stock is trading at $489.15, marking a daily decline of 3.22%. The price remains under pressure and is positioned below its key moving averages.
 304.00
318.17
Highlights
- Axon reported second-quarter 2026 revenue up 35% year-over-year to $904 million, with annual recurring revenue reaching $1.6 billion.
- The company is expanding its public safety technology through portfolio integration and acquisitions, focusing on the 911 ecosystem and winning new contracts.
- Shares of Axon trade under strong selling pressure, with bearish technical signals and an expected range of $469.84 to $506.14 in the next 2 to 3 days.
Revenue and backlog surge as public safety contracts drive demand
Axon reported second-quarter 2026 results with a 35% year-over-year increase in revenue to $904 million, a 39% rise in annual recurring revenue to $1.6 billion, and a 41% increase in contracted backlog to $15.1 billion, highlighting substantial business expansion and ongoing demand, according to Insidermonkey. At the Goldman Sachs Communacopia + Technology Conference on September 8, 2026, the company outlined its strategy to build on its established portfolio by integrating acquisitions, particularly focused on a growing 911 ecosystem, as noted by Investing.com. Separately, Newsweek reported that Axon continued to win public safety contracts in key regions like Colorado, underscoring increasing adoption of its integrated camera, in-car, and evidence management technologies, though price action has remained under broader selling pressure.
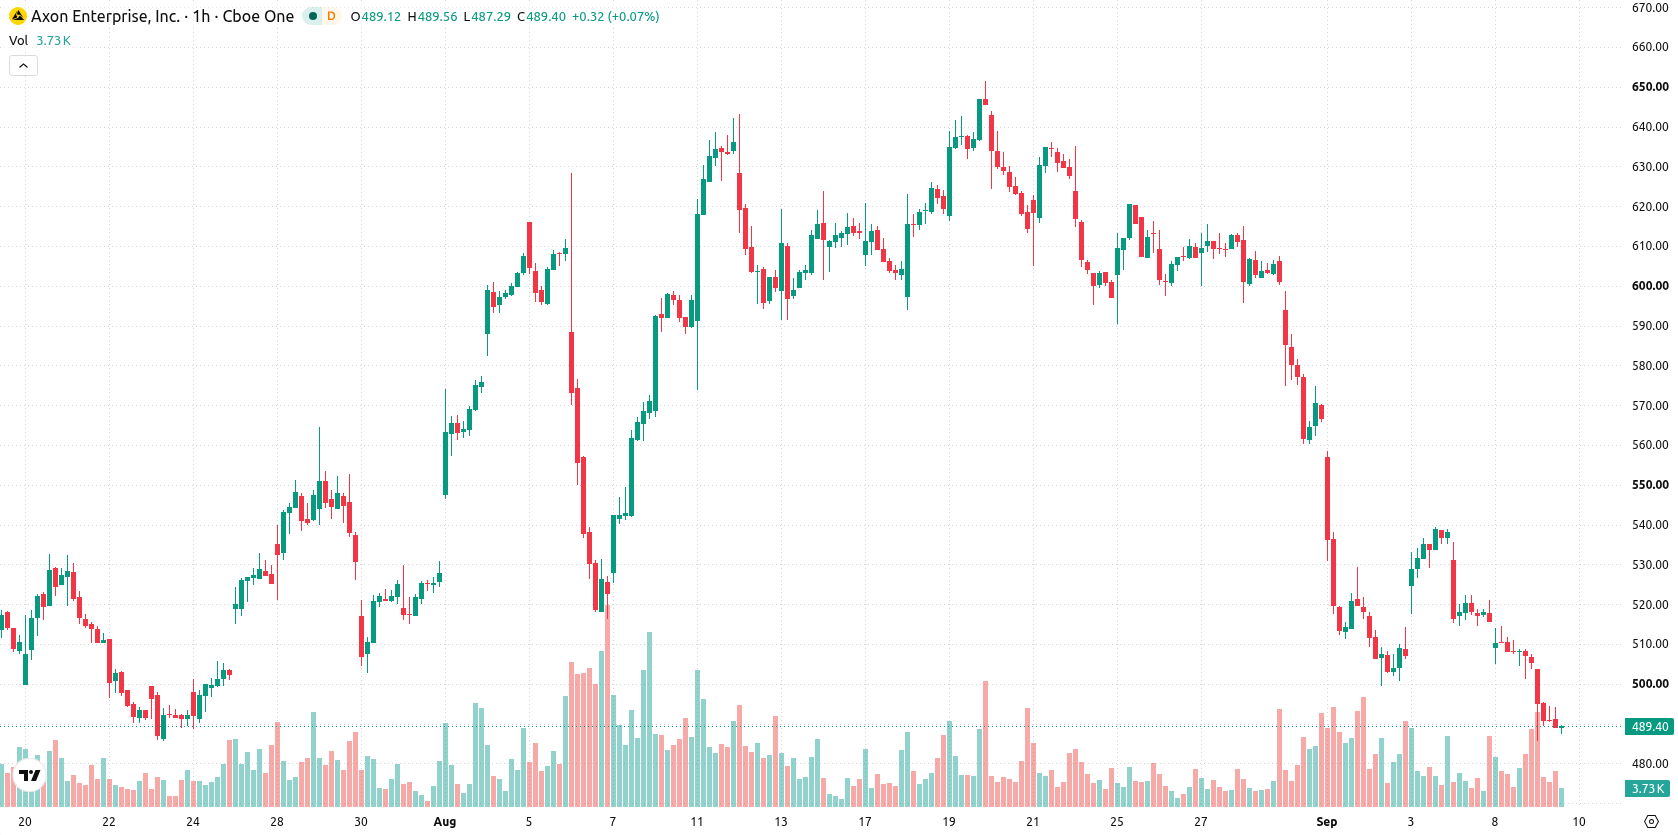
Technical resistance holds as bearish momentum and oversold signals intensify
On the hourly chart, AXON is trading below its MA-20, MA-50, and the longer-term MA-200, underscoring persistent short-, medium-, and long-term technical resistance. The Ichimoku Kijun now sits at $512.29, defining immediate resistance for any rebound, while nearby support is identified at $469.84. Momentum indicators such as MACD and ADX are decisively bearish, aligning with a strongly negative Bull/Bear Power reading. Oversold conditions are confirmed by an RSI deep at 23.91, and both Stochastic RSI and CCI reflect a continued stretch to the downside. The Awesome Oscillator also signals a prevailing negative trend.
Further downside risk as bearish bias persists within trading range
Over the next 2-3 sessions, AXON is expected to trade within the $469.84–$506.14 range, reflecting a volatility band in line with current selling pressure. Should the price drift lower and breach $469.84, further downside acceleration is likely. A reversal scenario would only gain traction if resistance at $512.29 is reclaimed, but near-term probabilities favor a continued bearish bias or rangebound consolidation.
Earlier, analysts noted that despite robust fundamental growth at Axon the stock remained under consistent bearish technical pressure. The current analysis reinforces this outlook by highlighting deep oversold conditions and persistent resistance, with traders advised to closely monitor the $469.84 support as a potential inflection point for further downside.






Latest Axon Enterprise Inc News




-
 Afghanistan
-
 Albania
-
 Algeria
-
 Angola
-
 Argentina
-
 Armenia
-
 Australia
-
 Austria
-
 Azerbaijan
-
 Bahamas
-
 Bahrain
-
 Bangladesh
-
 Belarus
-
 Belgium
-
 Bolivia
-
 Botswana
-
 Brazil
-
 Brunei
-
 Bulgaria
-
 Cambodia
-
 Cameroon
-
 Canada
-
 Chile
-
 China
-
 Colombia
-
 Congo
-
 Costa Rica
-
 Cote d'Ivoire
-
 Croatia
-
 Cuba
-
 Cyprus
-
 Czechia
-
 DR Congo
-
 Denmark
-
 Dominican Republic
-
 Ecuador
-
 Egypt
-
 El Salvador
-
 Estonia
-
 Eswatini
-
 Ethiopia
-
 Finland
-
 France
-
 Georgia
-
 Germany
-
 Ghana
-
 Greece
-
 Haiti
-
 Hong Kong
-
 Hungary
-
 India
-
 Indonesia
-
 Iran, Islamic republic
-
 Iraq
-
 Ireland
-
 Israel
-
 Italy
-
 Jamaica
-
 Japan
-
 Jordan
-
 Kazakhstan
-
 Kenya
-
 Korea
-
 Kuwait
-
 Kyrgyzstan
-
 Laos
-
 Latvia
-
 Lebanon
-
 Lesotho
-
 Libya
-
 Lithuania
-
 Luxembourg
-
 Madagascar
-
 Malaysia
-
 Malta
-
 Mauritius
-
 Mexico
-
 Moldova
-
 Mongolia
-
 Montenegro
-
 Morocco
-
 Mozambique
-
 Myanmar
-
 Namibia
-
 Nepal
-
 Netherlands
-
 New Zealand
-
 Nigeria
-
 North Macedonia
-
 Norway
-
 Oman
-
 Pakistan
-
 Palestine
-
 Panama
-
 Papua New Guinea
-
 Paraguay
-
 Peru
-
 Philippines
-
 Poland
-
 Portugal
-
 Puerto Rico
-
 Qatar
-
 Reunion
-
 Romania
-
 Rwanda
-
 Saudi Arabia
-
 Serbia
-
 Singapore
-
 Slovakia
-
 Slovenia
-
 Somalia
-
 South Africa
-
 Spain
-
 Sri Lanka
-
 Sweden
-
 Switzerland
-
 Syria
-
 Taiwan
-
 Tajikistan
-
 Tanzania
-
 Thailand
-
 Trinidad and Tobago
-
 Tunisia
-
 Turkey
-
 UAE
-
 Uganda
-
 Ukraine
-
 United Kingdom
-
United States
-
 Uruguay
-
 Uzbekistan
-
 Venezuela
-
 Vietnam
-
 Yemen
-
 Zambia
-
 Zimbabwe
- Forex
- Crypto












