

What's behind Celsius Holdings's latest stock pullback?

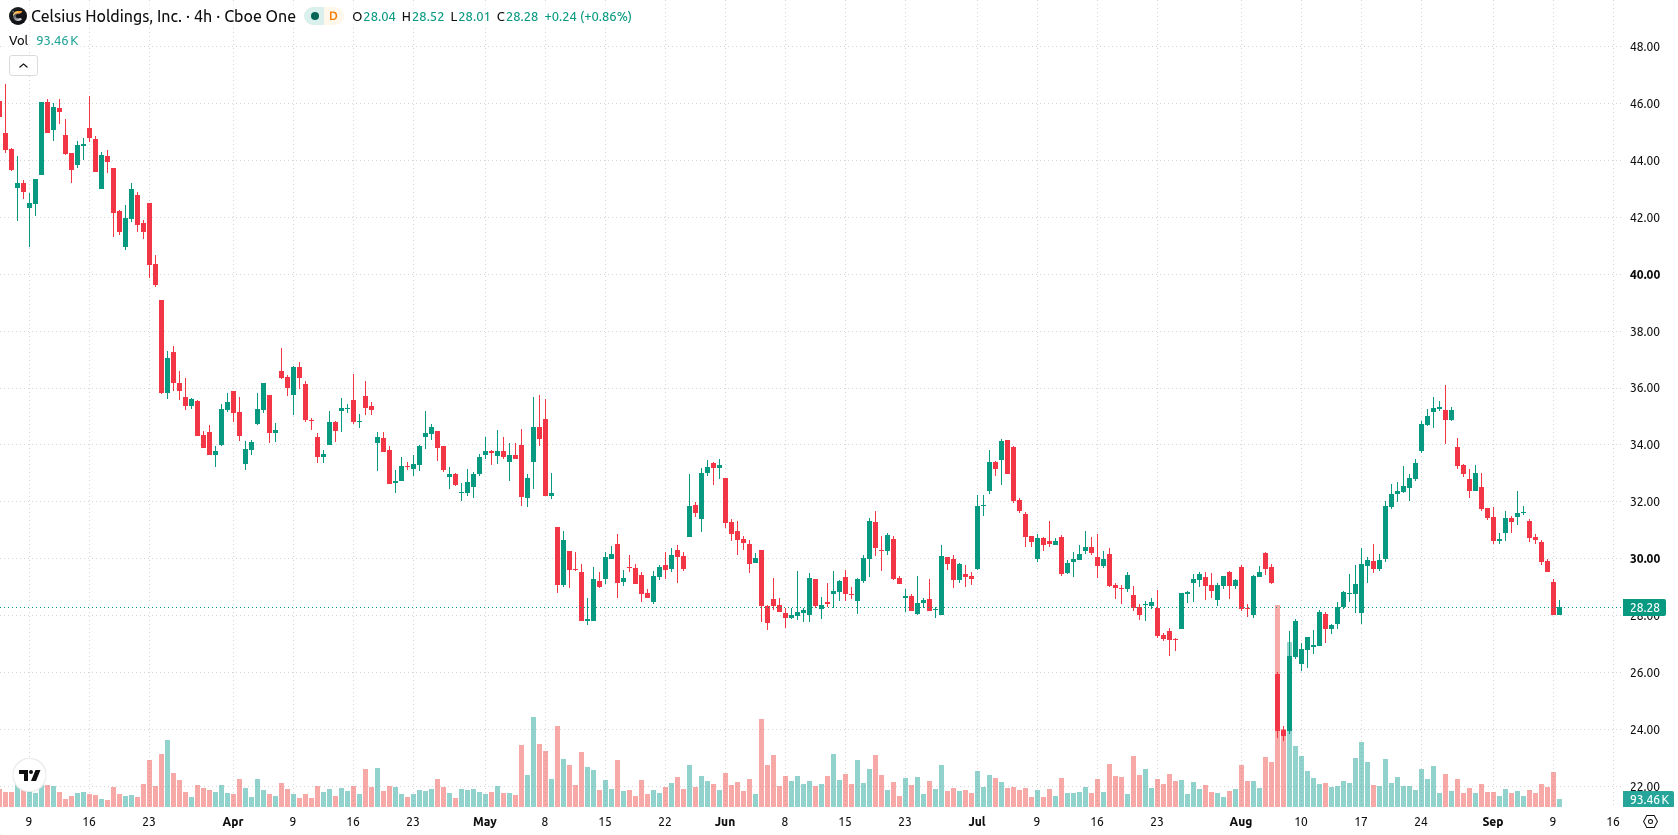
Celsius Holdings Inc. (CELH) slumped 4.05% as persistent downside momentum overpowered otherwise strong operational results. The selling pressure is supported by CELH trading below all key moving averages, reinforcing a firmly bearish technical structure.
 29.48
29.48
Highlights
- Celsius Holdings reported 83% year-over-year revenue growth driven by sustained consumer demand in the energy drink segment.
- New Buy-rated analyst coverage has been issued for Celsius Holdings, citing the company's strong growth profile and ongoing market momentum.
- Shares of Celsius Holdings trade below key moving averages, with a downward bias indicated and a 5-day projected range of $26.94 to $29.7.
Sustained selling persists despite analyst upgrades and robust revenue growth
Celsius Holdings reported approximately 83% year-over-year revenue growth, reflecting ongoing consumer demand in the energy drink market. The company has been the subject of new Buy-rated analyst coverage in light of its robust growth profile. Market risks and sentiment were also cited as considerations, though price action has remained under broader selling pressure.
Broad technical weakness as oversold signals outpace MACD divergence
Celsius Holdings is trading below the 20-day ($31.41), 50-day ($30.19), and 200-day ($37.68) moving averages, indicating persistent pressure from sellers across short-, medium-, and long-term trends. The nearest resistance and support are defined by the session’s high of $29.2 and low of $28.01, with longer-term trend confirmation remaining firmly bearish. Momentum signals are mixed: the Moving Average Convergence Divergence (MACD) indicates strong buy momentum, but the Average Directional Index (ADX) reads neutral. The Relative Strength Index (RSI) at 44.12, Commodity Channel Index (CCI) at -51.87, and Stochastic RSI at 0 all flag oversold or sell conditions, suggesting short-term exhaustion. Bull/Bear Power (BBP) at -0.71 signals sellers dominate, with an oversold pattern developing. The stock is trading at $28.32, down 4.05% on the day after a downside gap near 1.25%, currently positioned near the session low. Intraday volatility stands at 4.25%, and the tone remains under clear pressure following the open. This daily weakness is broadly confirmed by all major oscillators except the MACD, which poses a notable divergence.
Earlier, analysts noted that Celsius Holdings faced persistent long-term technical weakness despite some signs of short-term resilience. The latest price action reinforces this bearish view, with traders advised to monitor the $29.2 resistance and $28.01 support levels as key markers for a potential directional shift.











-
 Afghanistan
-
 Albania
-
 Algeria
-
 Angola
-
 Argentina
-
 Armenia
-
 Australia
-
 Austria
-
 Azerbaijan
-
 Bahamas
-
 Bahrain
-
 Bangladesh
-
 Belarus
-
 Belgium
-
 Bolivia
-
 Botswana
-
 Brazil
-
 Brunei
-
 Bulgaria
-
 Cambodia
-
 Cameroon
-
 Canada
-
 Chile
-
 China
-
 Colombia
-
 Congo
-
 Costa Rica
-
 Cote d'Ivoire
-
 Croatia
-
 Cuba
-
 Cyprus
-
 Czechia
-
 DR Congo
-
 Denmark
-
 Dominican Republic
-
 Ecuador
-
 Egypt
-
 El Salvador
-
 Estonia
-
 Eswatini
-
 Ethiopia
-
 Finland
-
 France
-
 Georgia
-
 Germany
-
 Ghana
-
 Greece
-
 Haiti
-
 Hong Kong
-
 Hungary
-
 India
-
 Indonesia
-
 Iran, Islamic republic
-
 Iraq
-
 Ireland
-
 Israel
-
 Italy
-
 Jamaica
-
 Japan
-
 Jordan
-
 Kazakhstan
-
 Kenya
-
 Korea
-
 Kuwait
-
 Kyrgyzstan
-
 Laos
-
 Latvia
-
 Lebanon
-
 Lesotho
-
 Libya
-
 Lithuania
-
 Luxembourg
-
 Madagascar
-
 Malaysia
-
 Malta
-
 Mauritius
-
 Mexico
-
 Moldova
-
 Mongolia
-
 Montenegro
-
 Morocco
-
 Mozambique
-
 Myanmar
-
 Namibia
-
 Nepal
-
 Netherlands
-
 New Zealand
-
 Nigeria
-
 North Macedonia
-
 Norway
-
 Oman
-
 Pakistan
-
 Palestine
-
 Panama
-
 Papua New Guinea
-
 Paraguay
-
 Peru
-
 Philippines
-
 Poland
-
 Portugal
-
 Puerto Rico
-
 Qatar
-
 Reunion
-
 Romania
-
 Rwanda
-
 Saudi Arabia
-
 Serbia
-
 Singapore
-
 Slovakia
-
 Slovenia
-
 Somalia
-
 South Africa
-
 Spain
-
 Sri Lanka
-
 Sweden
-
 Switzerland
-
 Syria
-
 Taiwan
-
 Tajikistan
-
 Tanzania
-
 Thailand
-
 Trinidad and Tobago
-
 Tunisia
-
 Turkey
-
 UAE
-
 Uganda
-
 Ukraine
-
 United Kingdom
-
United States
-
 Uruguay
-
 Uzbekistan
-
 Venezuela
-
 Vietnam
-
 Yemen
-
 Zambia
-
 Zimbabwe
- Forex
- Crypto












