


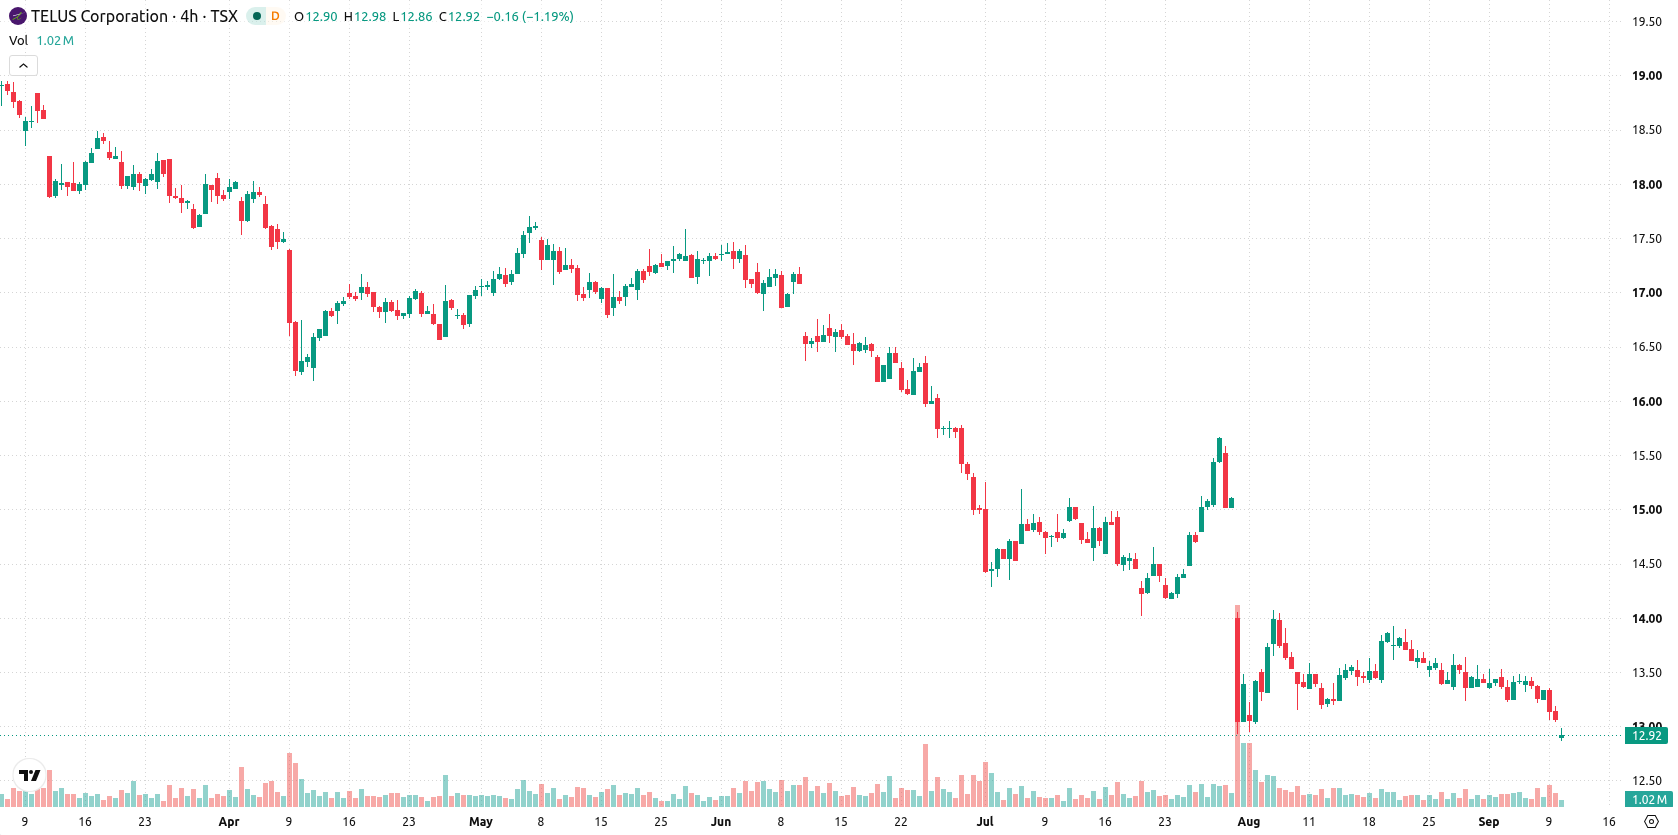
TELUS Corporation (T) fell 1.91% after its significant July 2026 dividend reduction, a move reflecting sustained financial pressures and restructuring efforts. The decline is supported by persistent technical weakness, with TELUS trading below all major moving averages and sellers dominating across all time frames.
 13.80
12.65
Highlights
- TELUS cut its dividend by 55% and recorded a $2.1 billion goodwill impairment related to AI adoption.
- The company lowered its 2026 free cash flow forecast from $2.45 billion to $1.8 billion and declared a $0.13 per share dividend.
- TELUS stock trades below key moving averages with strong bearish momentum, an expected five-day range of C$12.61 to C$13.10, and a high probability of further downside.
Cash flow strain drives dividend slash and guidance downgrade
In July 2026, TELUS cut its dividend by 55% in response to cash flow constraints and a goodwill impairment of $2.1 billion linked to AI adoption. The company lowered its 2026 free cash flow guidance from $2.45 billion to $1.8 billion. TELUS also declared a total dividend of $0.13 per share, with an ex-dividend date of September 10, 2026, and a payment date of October 1, 2026.
Persistent bearish momentum as TELUS stays under resistance
TELUS trades below the 20-day (C$13.46), 50-day (C$14.06), and 200-day (C$16.87) moving averages, indicating prevailing selling pressure over short, medium, and long-term horizons. The nearest resistance is at C$13.04 and support sits at C$12.61, with the longer-term technical structure remaining bearish. Momentum indicators are weak: MACD and ADX signal strong bearish momentum, RSI is at 33.92, CCI reads -197.02—both in oversold territory—and the Stochastic RSI is at zero. Bull/Bear Power is negative and the Awesome Oscillator confirms a downward trend, while intraday volatility stands at 2.38%.
Earlier, analysts noted that TELUS was exhibiting persistent technical weakness and heightened governance concerns, maintaining a bearish outlook. This latest update strengthens that conclusion with fresh evidence of strong downside momentum, highlighting the importance of monitoring C$12.61 as the next critical support level for potential further declines.










-
 Afghanistan
-
 Albania
-
 Algeria
-
 Angola
-
 Argentina
-
 Armenia
-
 Australia
-
 Austria
-
 Azerbaijan
-
 Bahamas
-
 Bahrain
-
 Bangladesh
-
 Belarus
-
 Belgium
-
 Bolivia
-
 Botswana
-
 Brazil
-
 Brunei
-
 Bulgaria
-
 Cambodia
-
 Cameroon
-
 Canada
-
 Chile
-
 China
-
 Colombia
-
 Congo
-
 Costa Rica
-
 Cote d'Ivoire
-
 Croatia
-
 Cuba
-
 Cyprus
-
 Czechia
-
 DR Congo
-
 Denmark
-
 Dominican Republic
-
 Ecuador
-
 Egypt
-
 El Salvador
-
 Estonia
-
 Eswatini
-
 Ethiopia
-
 Finland
-
 France
-
 Georgia
-
 Germany
-
 Ghana
-
 Greece
-
 Haiti
-
 Hong Kong
-
 Hungary
-
 India
-
 Indonesia
-
 Iran, Islamic republic
-
 Iraq
-
 Ireland
-
 Israel
-
 Italy
-
 Jamaica
-
 Japan
-
 Jordan
-
 Kazakhstan
-
 Kenya
-
 Korea
-
 Kuwait
-
 Kyrgyzstan
-
 Laos
-
 Latvia
-
 Lebanon
-
 Lesotho
-
 Libya
-
 Lithuania
-
 Luxembourg
-
 Madagascar
-
 Malaysia
-
 Malta
-
 Mauritius
-
 Mexico
-
 Moldova
-
 Mongolia
-
 Montenegro
-
 Morocco
-
 Mozambique
-
 Myanmar
-
 Namibia
-
 Nepal
-
 Netherlands
-
 New Zealand
-
 Nigeria
-
 North Macedonia
-
 Norway
-
 Oman
-
 Pakistan
-
 Palestine
-
 Panama
-
 Papua New Guinea
-
 Paraguay
-
 Peru
-
 Philippines
-
 Poland
-
 Portugal
-
 Puerto Rico
-
 Qatar
-
 Reunion
-
 Romania
-
 Rwanda
-
 Saudi Arabia
-
 Serbia
-
 Singapore
-
 Slovakia
-
 Slovenia
-
 Somalia
-
 South Africa
-
 Spain
-
 Sri Lanka
-
 Sweden
-
 Switzerland
-
 Syria
-
 Taiwan
-
 Tajikistan
-
 Tanzania
-
 Thailand
-
 Trinidad and Tobago
-
 Tunisia
-
 Turkey
-
 UAE
-
 Uganda
-
 Ukraine
-
 United Kingdom
-
United States
-
 Uruguay
-
 Uzbekistan
-
 Venezuela
-
 Vietnam
-
 Yemen
-
 Zambia
-
 Zimbabwe
- Forex
- Crypto












