


Take-Two Interactive Software, Inc. (TTWO) advanced 3.63% in a sharp intraday rally driven by technical buying interest emerging from deep oversold conditions. The rebound looks limited, with price still pinned below all key moving averages and persistent negative momentum indicators pointing to underlying selling pressure.
 201.35
208.05
Highlights
- Shares of Take-Two Interactive are trading below key moving averages, indicating seller pressure across all timeframes.
- Momentum indicators project a bearish outlook, with multiple oversold signals and negative readings for trading momentum.
- For the next five sessions, the expected trading range is $213.09 to $222.97, with a 77% probability of a downward move.
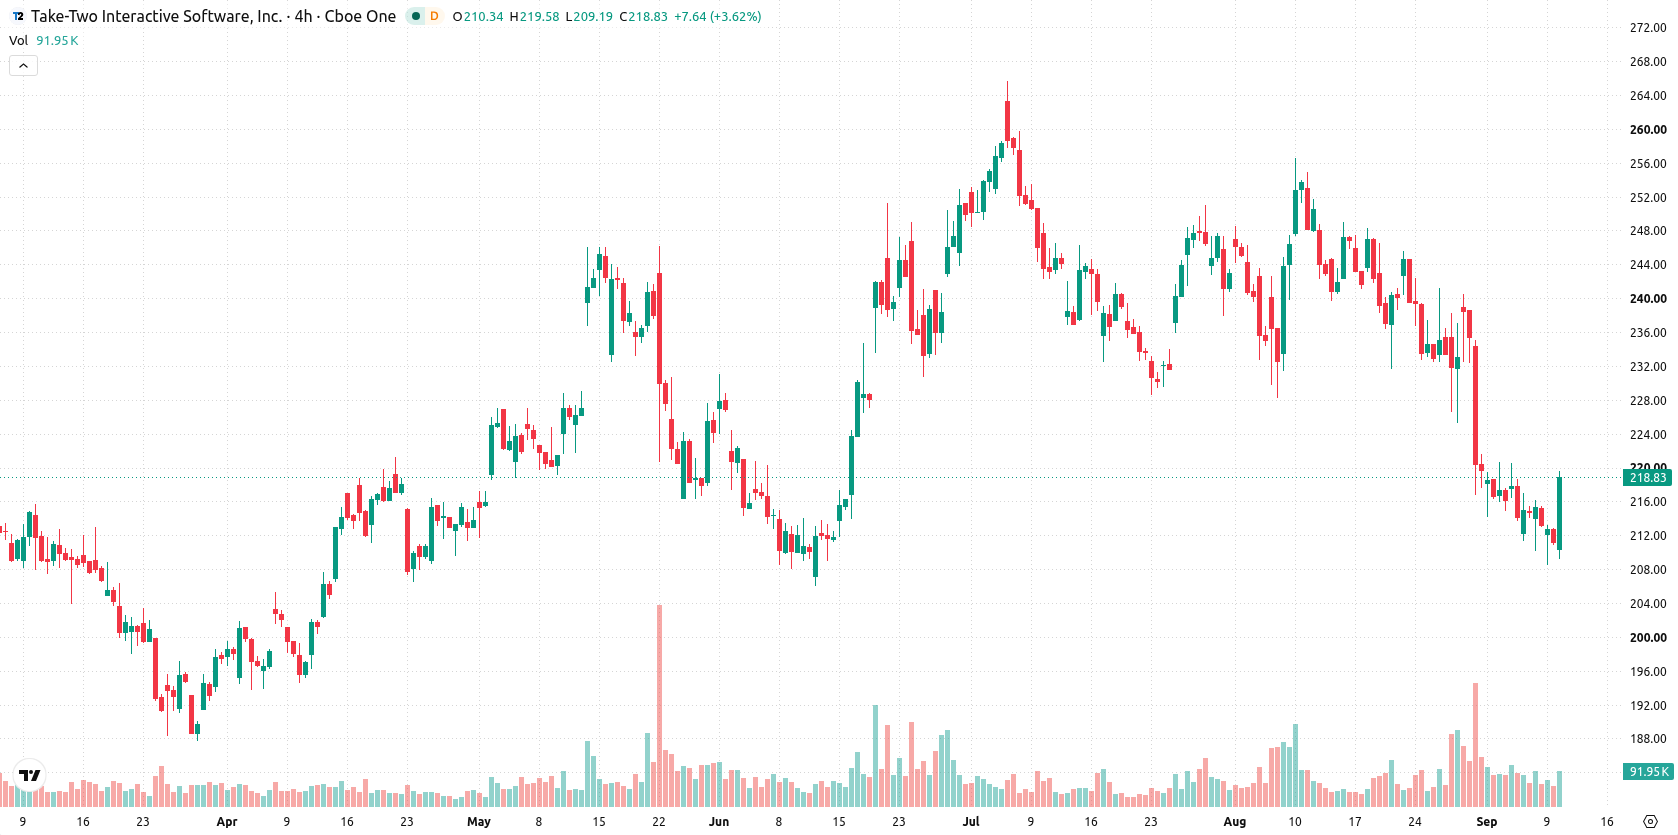
Bearish momentum persists as price holds below all moving averages
Take-Two Interactive is trading below the MA-20 ($230.34), MA-50 ($238.44), and MA-200 ($227.61), highlighting sustained pressure from sellers across all timeframes. The MA-50 remains above the MA-200, suggesting the underlying longer-term trend structure is still technically bullish, but the short-term tone is defined by the near-term ceiling at $222.97 and immediate support at $216.85. Technical momentum signals retain a bearish bias: MACD is negative and recommends "Sell," ADX is neutral, and the RSI sits deeply oversold at 29.19, alongside additional oversold calls from the Stochastic RSI and CCI. Bull/Bear Power (BBP) is negative at -9.04, confirming sellers’ dominance, and the Awesome Oscillator (AO) also aligns with a negative momentum outlook. Price action is near the session high after a gap down and a wide intraday range, but short-term momentum remains skewed to the downside.
Earlier, analysts noted that Take-Two shares were showing early signs of a technical recovery as market attention mounted ahead of the GTA VI release. The current technical landscape, however, highlights persistent downside momentum, so traders should closely monitor price action around the $213.09–$222.97 volatility band for any shift in short-term trend direction.






Latest Take-Two Interactive Software News



-
 Afghanistan
-
 Albania
-
 Algeria
-
 Angola
-
 Argentina
-
 Armenia
-
 Australia
-
 Austria
-
 Azerbaijan
-
 Bahamas
-
 Bahrain
-
 Bangladesh
-
 Belarus
-
 Belgium
-
 Bolivia
-
 Botswana
-
 Brazil
-
 Brunei
-
 Bulgaria
-
 Cambodia
-
 Cameroon
-
 Canada
-
 Chile
-
 China
-
 Colombia
-
 Congo
-
 Costa Rica
-
 Cote d'Ivoire
-
 Croatia
-
 Cuba
-
 Cyprus
-
 Czechia
-
 DR Congo
-
 Denmark
-
 Dominican Republic
-
 Ecuador
-
 Egypt
-
 El Salvador
-
 Estonia
-
 Eswatini
-
 Ethiopia
-
 Finland
-
 France
-
 Georgia
-
 Germany
-
 Ghana
-
 Greece
-
 Haiti
-
 Hong Kong
-
 Hungary
-
 India
-
 Indonesia
-
 Iran, Islamic republic
-
 Iraq
-
 Ireland
-
 Israel
-
 Italy
-
 Jamaica
-
 Japan
-
 Jordan
-
 Kazakhstan
-
 Kenya
-
 Korea
-
 Kuwait
-
 Kyrgyzstan
-
 Laos
-
 Latvia
-
 Lebanon
-
 Lesotho
-
 Libya
-
 Lithuania
-
 Luxembourg
-
 Madagascar
-
 Malaysia
-
 Malta
-
 Mauritius
-
 Mexico
-
 Moldova
-
 Mongolia
-
 Montenegro
-
 Morocco
-
 Mozambique
-
 Myanmar
-
 Namibia
-
 Nepal
-
 Netherlands
-
 New Zealand
-
 Nigeria
-
 North Macedonia
-
 Norway
-
 Oman
-
 Pakistan
-
 Palestine
-
 Panama
-
 Papua New Guinea
-
 Paraguay
-
 Peru
-
 Philippines
-
 Poland
-
 Portugal
-
 Puerto Rico
-
 Qatar
-
 Reunion
-
 Romania
-
 Rwanda
-
 Saudi Arabia
-
 Serbia
-
 Singapore
-
 Slovakia
-
 Slovenia
-
 Somalia
-
 South Africa
-
 Spain
-
 Sri Lanka
-
 Sweden
-
 Switzerland
-
 Syria
-
 Taiwan
-
 Tajikistan
-
 Tanzania
-
 Thailand
-
 Trinidad and Tobago
-
 Tunisia
-
 Turkey
-
 UAE
-
 Uganda
-
 Ukraine
-
 United Kingdom
-
United States
-
 Uruguay
-
 Uzbekistan
-
 Venezuela
-
 Vietnam
-
 Yemen
-
 Zambia
-
 Zimbabwe
- Forex
- Crypto












