

Nano Dimension stock outlook: Reversal setup in focus

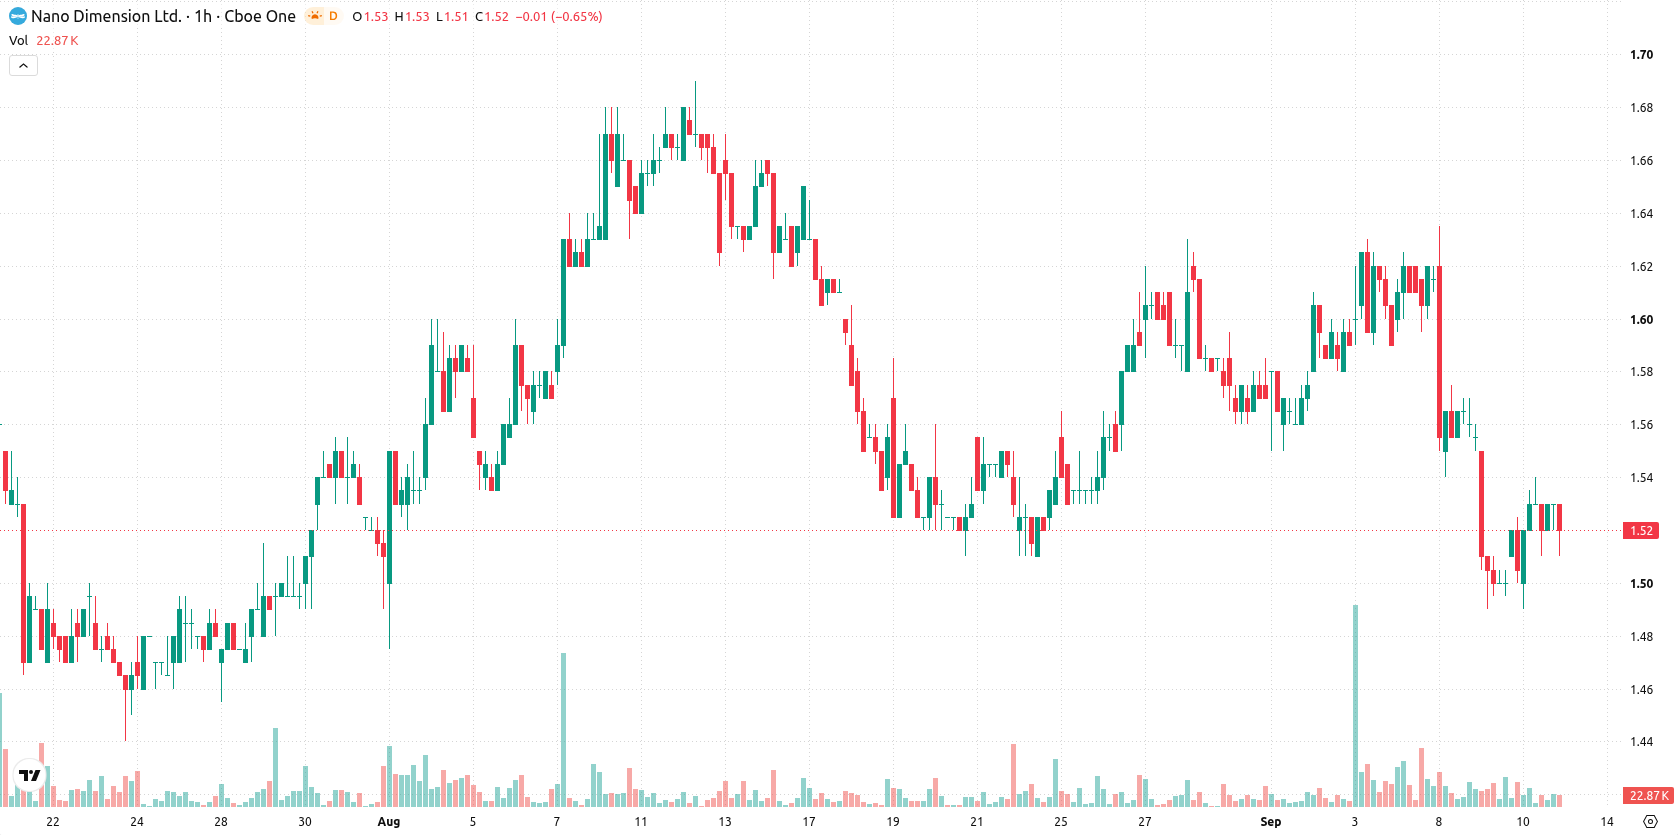
Nano Dimension (NNDM) stock is trading at $1.52, up 1% on the day. The price sits below its key moving averages, reflecting short-term upside in a generally pressured context.
 1.28
1.38
Highlights
- NNDM/USD stock trades below key moving averages on both hourly and daily charts, signaling persistent downside pressure.
- Momentum indicators collectively confirm a strong sell bias, with a very high probability of continued bearish movement.
- The expected trading range for the next 2 to 3 days is $1.45 to $1.59, with $1.57 as resistance and $1.45 as key support.
Momentum bias tilts bearish as resistance holds above
On the H1 chart, NNDM is trading below both the MA-20 at $1.53 and the MA-50 at $1.57, while the daily MA-200 stands higher at $1.67. Immediate resistance appears at the Ichimoku Kijun line at $1.57, with support identified near $1.45. Momentum indicators show MACD at Strong Sell and ADX at Sell, while RSI sits at 39.81 and Stoch RSI points to Strong Sell. CCI reads as neutral, as does the Awesome Oscillator, while Bull/Bear Power signals buyer strength intraday. Despite some short-term buying, most momentum and oscillator readings reinforce a prevailing selling bias.
Downside move favored on weak breakout prospects
Over the next two to three trading days, NNDM is expected to trade within a $1.45 to $1.59 range, consistent with typical volatility. The probability of a sustained upward breakout remains very low, while the likelihood of a downward move through the $1.45 support zone is assessed as very high. Unless price action breaks above $1.57 resistance, the baseline scenario suggests continued range-bound behavior around current levels.
Earlier, analysts noted that Nano Dimension was exhibiting persistent bearish momentum with elevated downside risk. The latest technical readings confirm this outlook, with traders advised to closely watch the $1.45 support level as a potential trigger for further declines.






Latest Nano Dimension News




-
 Afghanistan
-
 Albania
-
 Algeria
-
 Angola
-
 Argentina
-
 Armenia
-
 Australia
-
 Austria
-
 Azerbaijan
-
 Bahamas
-
 Bahrain
-
 Bangladesh
-
 Belarus
-
 Belgium
-
 Bolivia
-
 Botswana
-
 Brazil
-
 Brunei
-
 Bulgaria
-
 Cambodia
-
 Cameroon
-
 Canada
-
 Chile
-
 China
-
 Colombia
-
 Congo
-
 Costa Rica
-
 Cote d'Ivoire
-
 Croatia
-
 Cuba
-
 Cyprus
-
 Czechia
-
 DR Congo
-
 Denmark
-
 Dominican Republic
-
 Ecuador
-
 Egypt
-
 El Salvador
-
 Estonia
-
 Eswatini
-
 Ethiopia
-
 Finland
-
 France
-
 Georgia
-
 Germany
-
 Ghana
-
 Greece
-
 Haiti
-
 Hong Kong
-
 Hungary
-
 India
-
 Indonesia
-
 Iran, Islamic republic
-
 Iraq
-
 Ireland
-
 Israel
-
 Italy
-
 Jamaica
-
 Japan
-
 Jordan
-
 Kazakhstan
-
 Kenya
-
 Korea
-
 Kuwait
-
 Kyrgyzstan
-
 Laos
-
 Latvia
-
 Lebanon
-
 Lesotho
-
 Libya
-
 Lithuania
-
 Luxembourg
-
 Madagascar
-
 Malaysia
-
 Malta
-
 Mauritius
-
 Mexico
-
 Moldova
-
 Mongolia
-
 Montenegro
-
 Morocco
-
 Mozambique
-
 Myanmar
-
 Namibia
-
 Nepal
-
 Netherlands
-
 New Zealand
-
 Nigeria
-
 North Macedonia
-
 Norway
-
 Oman
-
 Pakistan
-
 Palestine
-
 Panama
-
 Papua New Guinea
-
 Paraguay
-
 Peru
-
 Philippines
-
 Poland
-
 Portugal
-
 Puerto Rico
-
 Qatar
-
 Reunion
-
 Romania
-
 Rwanda
-
 Saudi Arabia
-
 Serbia
-
 Singapore
-
 Slovakia
-
 Slovenia
-
 Somalia
-
 South Africa
-
 Spain
-
 Sri Lanka
-
 Sweden
-
 Switzerland
-
 Syria
-
 Taiwan
-
 Tajikistan
-
 Tanzania
-
 Thailand
-
 Trinidad and Tobago
-
 Tunisia
-
 Turkey
-
 UAE
-
 Uganda
-
 Ukraine
-
 United Kingdom
-
United States
-
 Uruguay
-
 Uzbekistan
-
 Venezuela
-
 Vietnam
-
 Yemen
-
 Zambia
-
 Zimbabwe
- Forex
- Crypto












