

BKR slides around 3.5% as acquisition-related costs and margin pressures drive selling

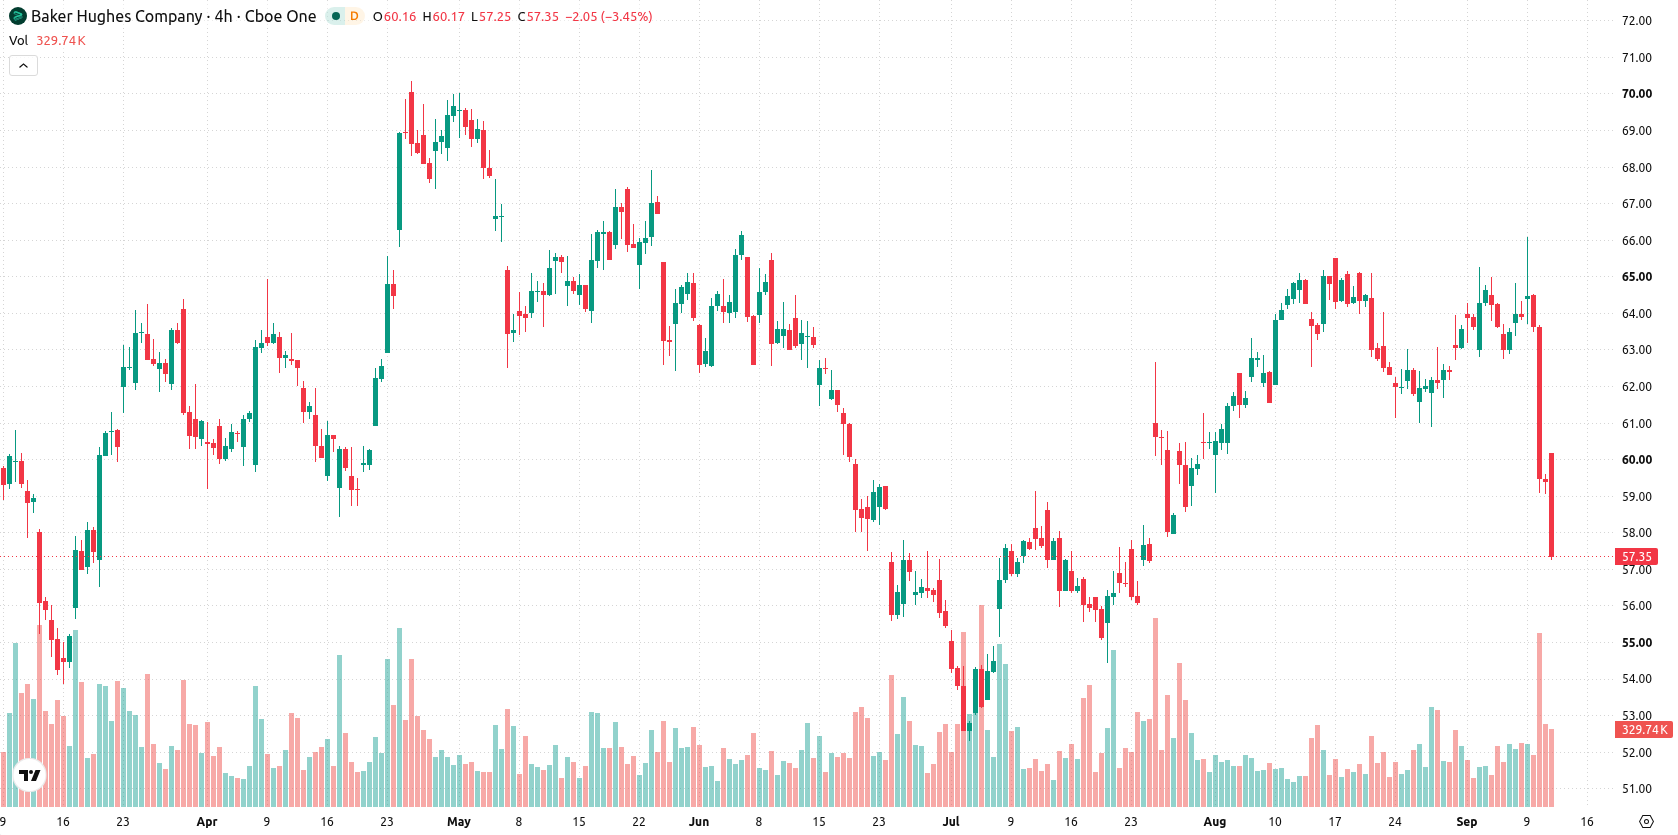
Baker Hughes Company (BKR) slid 3.46% after CEO Lorenzo Simonelli disclosed at the Barclays conference that integration costs and weaker-than-expected margins from the Chart Industries acquisition are reducing near-term profits. The decline is reinforced by the stock trading below all major moving averages, pointing to broad-based selling pressure.
 55.76
59.06
Highlights
- Baker Hughes stock sold off after the company announced higher integration costs and weaker-than-anticipated margins from its Chart Industries acquisition.
- New 2026 guidance projects a reduced near-term profit contribution from the acquisition, with long-term revenue benefits still acknowledged.
- Shares are trading below key moving averages with oscillators indicating an oversold condition and a 65% probability of further downside toward $53.82 in the next five days.
Near-term margin disappointment as investor focus shifts to guidance
Baker Hughes reported integration costs and weaker-than-expected margins following its acquisition of Chart Industries, as noted by CEO Lorenzo Simonelli at the Barclays conference. The company presented updated 2026 guidance indicating a lower profit contribution from the acquisition. Investor concerns about immediate profitability led to heavy selling, with longer-term revenue benefits acknowledged but overshadowed by near-term margin pressure.
Oversold signals and mixed momentum amid entrenched seller activity
Baker Hughes is trading below all key moving averages, with the current price at $57.34 positioned under the MA-20 ($63.18), MA-50 ($60.33), and MA-200 ($58.71). This configuration signals persistent pressure from sellers across short-, medium-, and long-term timeframes, despite the MA-50 versus MA-200 alignment still reflecting a bullish long-term trend. The nearest resistance is at $57.62, and the closest support is at $53.82. Momentum readings are mixed: the MACD suggests strong buy momentum, but the ADX indicates a neutral trend. The RSI at 36.79, Stochastic RSI at 0, and CCI at -184.36 all signal the stock is in oversold territory. Bull/Bear Power (BBP) at 0.89 shows buyers dominate intraday, paired with an overbought signal, highlighting a market out of balance. The price is near the day’s low after an upside gap of approximately $0.24 (0.4%), declining $2.05 or 3.46% on the session. Intraday volatility stands at 4.43%, with tone heavily pressured following the open. There is a clear divergence between oversold oscillator readings and the BBP, underlining uncertainty in near-term direction.
Earlier, analysts noted that heightened geopolitical tensions and energy market disruptions had amplified inflation risks and contributed to increased volatility across equity markets. The recent selloff in Baker Hughes underscores company-specific headwinds that now overshadow broader market drivers, with the current support at $53.82 emerging as a critical level for traders to monitor in the near term.






Latest Baker Hughes Co News




-
 Afghanistan
-
 Albania
-
 Algeria
-
 Angola
-
 Argentina
-
 Armenia
-
 Australia
-
 Austria
-
 Azerbaijan
-
 Bahamas
-
 Bahrain
-
 Bangladesh
-
 Belarus
-
 Belgium
-
 Bolivia
-
 Botswana
-
 Brazil
-
 Brunei
-
 Bulgaria
-
 Cambodia
-
 Cameroon
-
 Canada
-
 Chile
-
 China
-
 Colombia
-
 Congo
-
 Costa Rica
-
 Cote d'Ivoire
-
 Croatia
-
 Cuba
-
 Cyprus
-
 Czechia
-
 DR Congo
-
 Denmark
-
 Dominican Republic
-
 Ecuador
-
 Egypt
-
 El Salvador
-
 Estonia
-
 Eswatini
-
 Ethiopia
-
 Finland
-
 France
-
 Georgia
-
 Germany
-
 Ghana
-
 Greece
-
 Haiti
-
 Hong Kong
-
 Hungary
-
 India
-
 Indonesia
-
 Iran, Islamic republic
-
 Iraq
-
 Ireland
-
 Israel
-
 Italy
-
 Jamaica
-
 Japan
-
 Jordan
-
 Kazakhstan
-
 Kenya
-
 Korea
-
 Kuwait
-
 Kyrgyzstan
-
 Laos
-
 Latvia
-
 Lebanon
-
 Lesotho
-
 Libya
-
 Lithuania
-
 Luxembourg
-
 Madagascar
-
 Malaysia
-
 Malta
-
 Mauritius
-
 Mexico
-
 Moldova
-
 Mongolia
-
 Montenegro
-
 Morocco
-
 Mozambique
-
 Myanmar
-
 Namibia
-
 Nepal
-
 Netherlands
-
 New Zealand
-
 Nigeria
-
 North Macedonia
-
 Norway
-
 Oman
-
 Pakistan
-
 Palestine
-
 Panama
-
 Papua New Guinea
-
 Paraguay
-
 Peru
-
 Philippines
-
 Poland
-
 Portugal
-
 Puerto Rico
-
 Qatar
-
 Reunion
-
 Romania
-
 Rwanda
-
 Saudi Arabia
-
 Serbia
-
 Singapore
-
 Slovakia
-
 Slovenia
-
 Somalia
-
 South Africa
-
 Spain
-
 Sri Lanka
-
 Sweden
-
 Switzerland
-
 Syria
-
 Taiwan
-
 Tajikistan
-
 Tanzania
-
 Thailand
-
 Trinidad and Tobago
-
 Tunisia
-
 Turkey
-
 UAE
-
 Uganda
-
 Ukraine
-
 United Kingdom
-
United States
-
 Uruguay
-
 Uzbekistan
-
 Venezuela
-
 Vietnam
-
 Yemen
-
 Zambia
-
 Zimbabwe
- Forex
- Crypto












