


Baker Hughes Co (BKR) surged 3.99% as investors positioned ahead of its third-quarter 2026 earnings report, with rising revenue estimates and expectations of higher oil prices helping fuel optimism. The rebound looks limited, with BKR still trading below its 20-day, 50-day, and 200-day moving averages.
 55.77
59.06
Highlights
- Baker Hughes is expected to report higher third-quarter 2026 revenue as increased oil prices benefit the company.
- The quarter may be affected by project delays, supply chain challenges, and operating cost increases from Middle East disruptions.
- Shares of Baker Hughes trade below key moving averages with strong bearish momentum, projected to range between $53.84 to $58.1 over the next five days.
Revenue gains expected as oil price tailwinds offset operational headwinds
Baker Hughes is set to report its third-quarter 2026 earnings on October 27 after market close. The quarter is expected to show rising revenue estimates, with the company benefiting from higher oil prices. Operations may have faced headwinds from project delays, supply chain issues, and increased operating costs due to Middle East disruptions.
Sustained bearish momentum as price stays below key averages
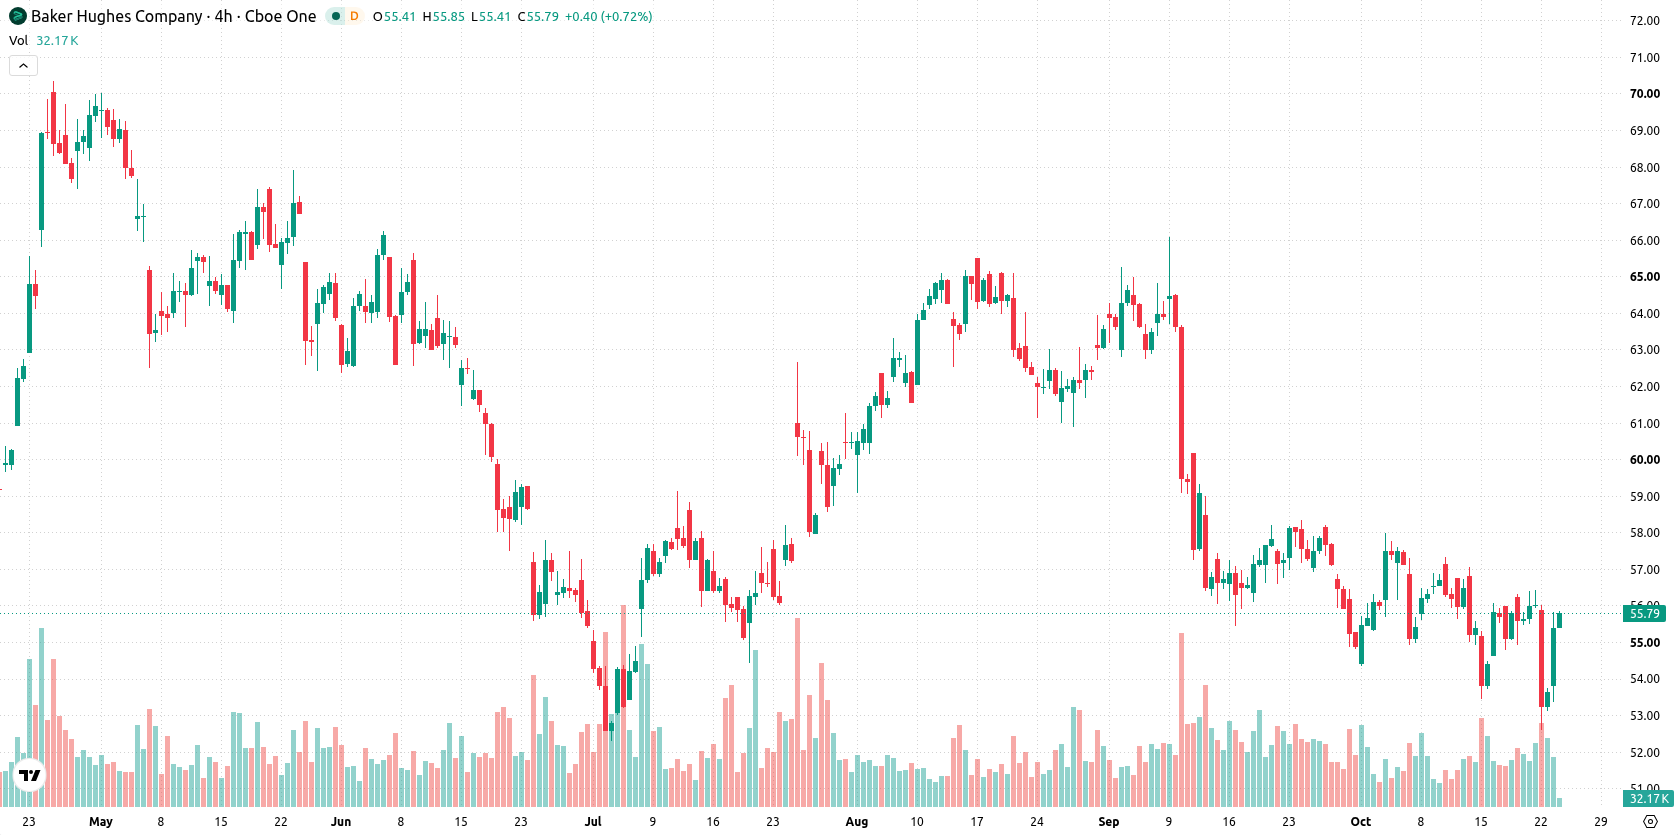
Baker Hughes is trading below its 20-day ($55.98), 50-day ($59.12), and 200-day ($60.05) moving averages, pointing to sustained selling pressure across all timeframes. The nearest resistance stands at $55.77, with short-term support at $55.39, and a bearish longer-term bias confirmed by the 50-day and 200-day average alignment. Momentum indicators remain negative: the MACD and ADX signal ongoing downside, while the RSI at 35.8, Stochastic RSI at 0, and CCI at -190.33 highlight oversold conditions. Bull/Bear Power (BBP) is positive at 0.36, reflecting brief intraday buying, but the overall outlook stays weak. The Awesome Oscillator is neutral, providing no clear direction. Despite a 3.99% gain and strong trades near the session's highs, this short-term strength contrasts with persistent bearish momentum signals.
Earlier, analysts noted that Baker Hughes continued to face broad selling pressure despite its efforts to expand its energy technology portfolio and secure new international projects. The current outlook reinforces this technical weakness, with traders advised to closely monitor the $55.39 support level, as a sustained break below it could accelerate downside risk.








-
 Afghanistan
-
 Albania
-
 Algeria
-
 Angola
-
 Argentina
-
 Armenia
-
 Australia
-
 Austria
-
 Azerbaijan
-
 Bahamas
-
 Bahrain
-
 Bangladesh
-
 Belarus
-
 Belgium
-
 Bolivia
-
 Botswana
-
 Brazil
-
 Brunei
-
 Bulgaria
-
 Cambodia
-
 Cameroon
-
 Canada
-
 Chile
-
 China
-
 Colombia
-
 Congo
-
 Costa Rica
-
 Cote d'Ivoire
-
 Croatia
-
 Cuba
-
 Cyprus
-
 Czechia
-
 DR Congo
-
 Denmark
-
 Dominican Republic
-
 Ecuador
-
 Egypt
-
 El Salvador
-
 Estonia
-
 Eswatini
-
 Ethiopia
-
 Finland
-
 France
-
 Georgia
-
 Germany
-
 Ghana
-
 Greece
-
 Haiti
-
 Hong Kong
-
 Hungary
-
 India
-
 Indonesia
-
 Iran, Islamic republic
-
 Iraq
-
 Ireland
-
 Israel
-
 Italy
-
 Jamaica
-
 Japan
-
 Jordan
-
 Kazakhstan
-
 Kenya
-
 Korea
-
 Kuwait
-
 Kyrgyzstan
-
 Laos
-
 Latvia
-
 Lebanon
-
 Lesotho
-
 Libya
-
 Lithuania
-
 Luxembourg
-
 Madagascar
-
 Malaysia
-
 Malta
-
 Mauritius
-
 Mexico
-
 Moldova
-
 Mongolia
-
 Montenegro
-
 Morocco
-
 Mozambique
-
 Myanmar
-
 Namibia
-
 Nepal
-
 Netherlands
-
 New Zealand
-
 Nigeria
-
 North Macedonia
-
 Norway
-
 Oman
-
 Pakistan
-
 Palestine
-
 Panama
-
 Papua New Guinea
-
 Paraguay
-
 Peru
-
 Philippines
-
 Poland
-
 Portugal
-
 Puerto Rico
-
 Qatar
-
 Reunion
-
 Romania
-
 Rwanda
-
 Saudi Arabia
-
 Serbia
-
 Singapore
-
 Slovakia
-
 Slovenia
-
 Somalia
-
 South Africa
-
 Spain
-
 Sri Lanka
-
 Sweden
-
 Switzerland
-
 Syria
-
 Taiwan
-
 Tajikistan
-
 Tanzania
-
 Thailand
-
 Trinidad and Tobago
-
 Tunisia
-
 Turkey
-
 UAE
-
 Uganda
-
 Ukraine
-
 United Kingdom
-
United States
-
 Uruguay
-
 Uzbekistan
-
 Venezuela
-
 Vietnam
-
 Yemen
-
 Zambia
-
 Zimbabwe
- Forex
- Crypto












