

Baker Hughes stock falls nearly 4% as downside momentum intensifies below key moving averages

Baker Hughes Company (BKR) dropped 3.81% after persistent selling pressure weighed on the shares, even as the company's latest initiatives to expand its energy technology portfolio remained in focus. The downside move is reinforced by the stock trading below all major moving averages and facing strong overhead resistance.
 55.77
59.06
Highlights
- Baker Hughes expanded its international presence by acquiring Chart Industries and partnering with New Stratus Energy for new oil and gas projects.
- The company will provide technology for Venezuela's first natural gas export project through agreements with PDVSA, Lindsayca, and Fulcrum.
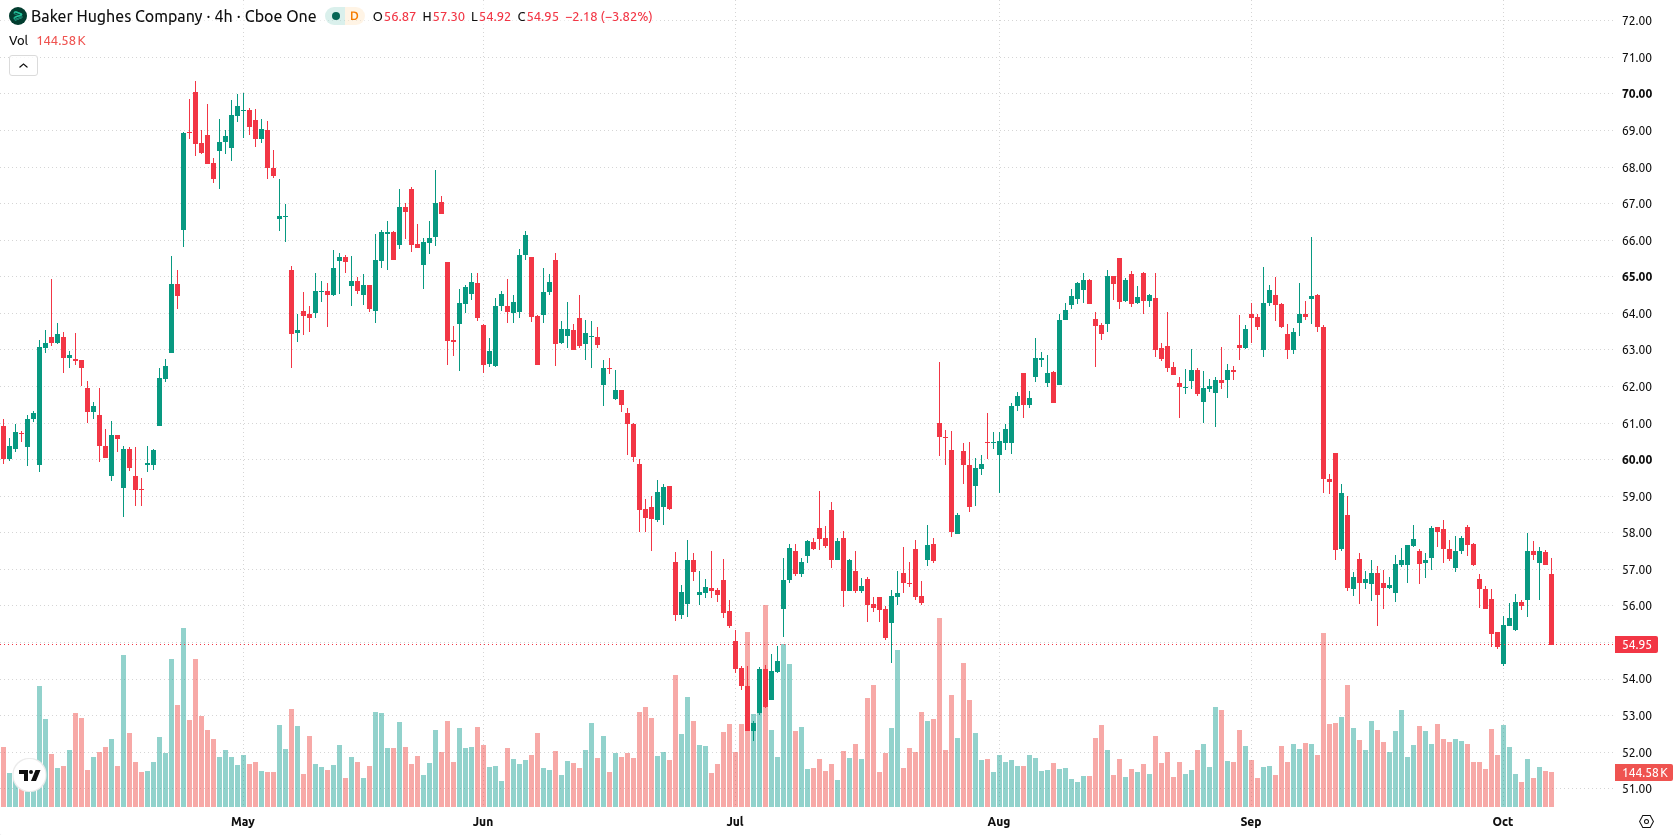
- Shares of Baker Hughes fell 3.81% to $54.96 and remain under technical pressure, with a predicted five-day price range of $53.19 to $57.38 and a higher probability of downside movement.
International project gains countered by ongoing broad-based selling pressure
Baker Hughes advanced its diversification strategy with the acquisition of Chart Industries, retaining Chart's management and product offerings. The company also signed a memorandum of understanding with New Stratus Energy to supply technologies for upcoming oil and gas projects, notably contributing to Venezuela's first natural gas export initiative through collaborations with PDVSA, Lindsayca, and Fulcrum. These actions positioned Baker Hughes as a technology provider for new international energy projects, though price action has remained under broader selling pressure.
Seller dominance confirmed as mixed momentum clashes with resistance levels
Baker Hughes is trading below all major moving averages, with the current price of $54.96 under both the 20-day ($57.40), 50-day ($60.56), and 200-day ($59.47) averages. This setup signals persistent seller dominance across timeframes, with the Ichimoku Kijun at $60.22 acting as distant resistance and a bullish long-term MA-50 vs MA-200 alignment. The immediate support is seen at $54.90 and resistance at $57.30. Momentum readings are mixed: MACD signals a strong sell, while ADX remains neutral and suggests weak trend conviction. The RSI signals a sell bias without hitting oversold territory. Stochastic RSI is markedly overbought at 93.12, while CCI is neutral. Bull/Bear Power stands at 0.51, indicating buyers lead intraday next to an overbought reading. Price action today reflects a downside gap and pressure after the open, with intraday volatility at 4.37%. Oscillator divergence persists, with some indicators suggesting overbought conditions even as downward momentum dominates.
Earlier, analysts noted that Baker Hughes was experiencing sustained selling pressure despite ongoing investment demand and positive sector developments. The current article affirms this technical weakness while highlighting that traders should monitor the $53.19 support level in the event downside volatility intensifies.






Latest Baker Hughes Co News





-
 Afghanistan
-
 Albania
-
 Algeria
-
 Angola
-
 Argentina
-
 Armenia
-
 Australia
-
 Austria
-
 Azerbaijan
-
 Bahamas
-
 Bahrain
-
 Bangladesh
-
 Belarus
-
 Belgium
-
 Bolivia
-
 Botswana
-
 Brazil
-
 Brunei
-
 Bulgaria
-
 Cambodia
-
 Cameroon
-
 Canada
-
 Chile
-
 China
-
 Colombia
-
 Congo
-
 Costa Rica
-
 Cote d'Ivoire
-
 Croatia
-
 Cuba
-
 Cyprus
-
 Czechia
-
 DR Congo
-
 Denmark
-
 Dominican Republic
-
 Ecuador
-
 Egypt
-
 El Salvador
-
 Estonia
-
 Eswatini
-
 Ethiopia
-
 Finland
-
 France
-
 Georgia
-
 Germany
-
 Ghana
-
 Greece
-
 Haiti
-
 Hong Kong
-
 Hungary
-
 India
-
 Indonesia
-
 Iran, Islamic republic
-
 Iraq
-
 Ireland
-
 Israel
-
 Italy
-
 Jamaica
-
 Japan
-
 Jordan
-
 Kazakhstan
-
 Kenya
-
 Korea
-
 Kuwait
-
 Kyrgyzstan
-
 Laos
-
 Latvia
-
 Lebanon
-
 Lesotho
-
 Libya
-
 Lithuania
-
 Luxembourg
-
 Madagascar
-
 Malaysia
-
 Malta
-
 Mauritius
-
 Mexico
-
 Moldova
-
 Mongolia
-
 Montenegro
-
 Morocco
-
 Mozambique
-
 Myanmar
-
 Namibia
-
 Nepal
-
 Netherlands
-
 New Zealand
-
 Nigeria
-
 North Macedonia
-
 Norway
-
 Oman
-
 Pakistan
-
 Palestine
-
 Panama
-
 Papua New Guinea
-
 Paraguay
-
 Peru
-
 Philippines
-
 Poland
-
 Portugal
-
 Puerto Rico
-
 Qatar
-
 Reunion
-
 Romania
-
 Rwanda
-
 Saudi Arabia
-
 Serbia
-
 Singapore
-
 Slovakia
-
 Slovenia
-
 Somalia
-
 South Africa
-
 Spain
-
 Sri Lanka
-
 Sweden
-
 Switzerland
-
 Syria
-
 Taiwan
-
 Tajikistan
-
 Tanzania
-
 Thailand
-
 Trinidad and Tobago
-
 Tunisia
-
 Turkey
-
 UAE
-
 Uganda
-
 Ukraine
-
 United Kingdom
-
United States
-
 Uruguay
-
 Uzbekistan
-
 Venezuela
-
 Vietnam
-
 Yemen
-
 Zambia
-
 Zimbabwe
- Forex
- Crypto












