

BKR slumps about 4.5% as technical signals confirm weak sentiment despite firm project demand

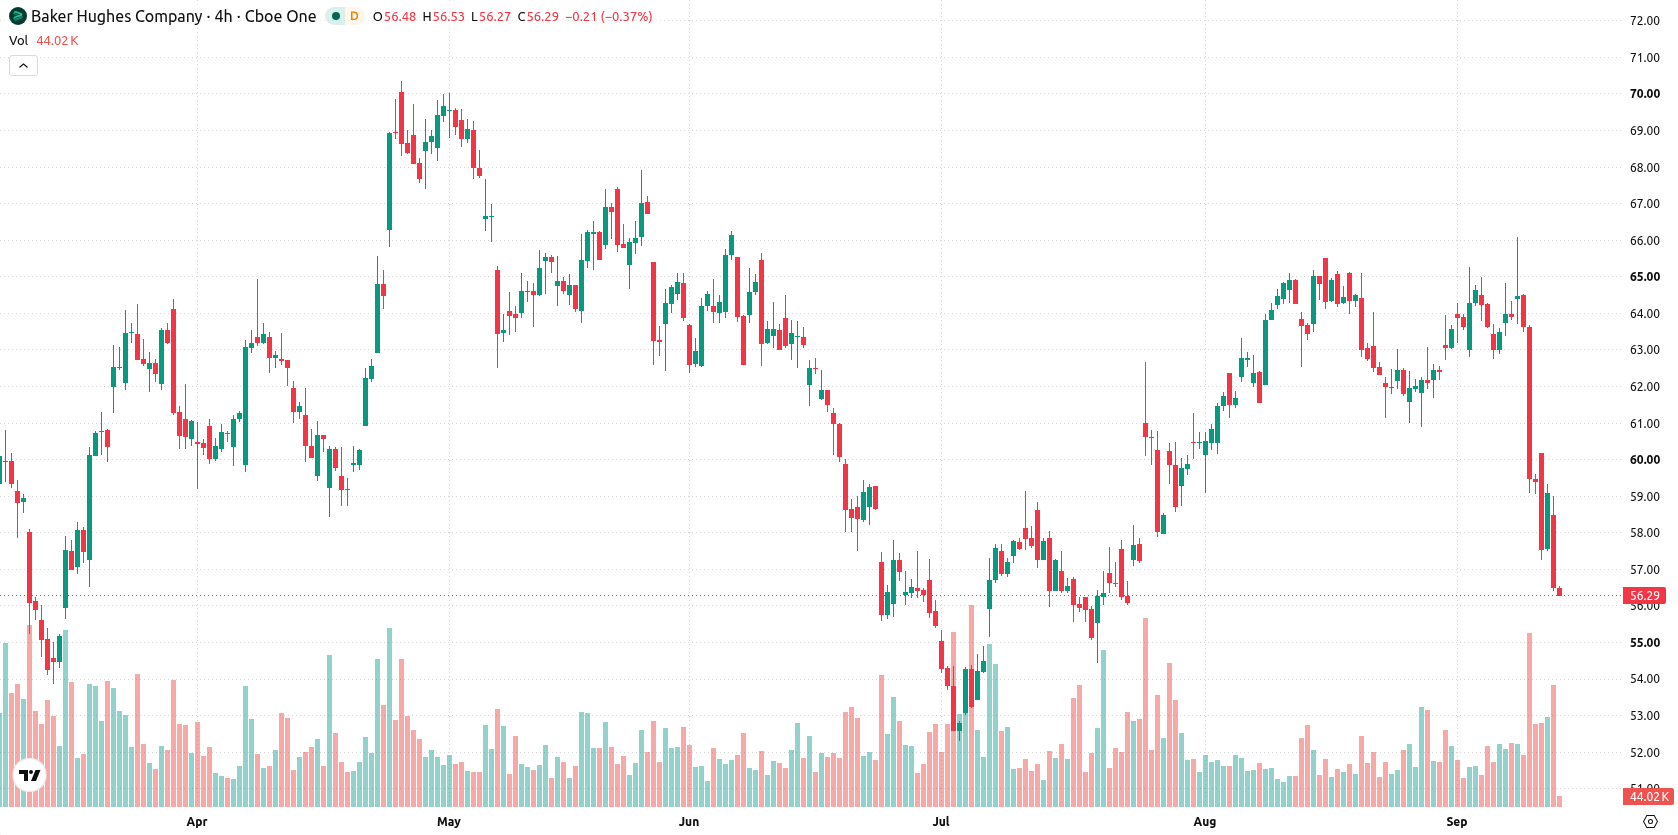
Baker Hughes Company (BKR) slumped 4.55% after decisive technical weakness followed a downside gap, even as corporate updates continued to highlight firm investment demand for energy projects. The move is supported by the stock's breakdown below its 20-day, 50-day, and 200-day moving averages, confirming sustained selling pressure.
 55.77
59.06
Highlights
- Baker Hughes confirmed investment in major energy projects remains steady, with higher borrowing costs not affecting sector capital commitments.
- Demand connected to artificial intelligence is supporting new investment in LNG and energy infrastructure projects.
- Shares of Baker Hughes last traded at $56.35, under heavy selling pressure with technical signals pointing to further weakness and a five-day expected range of $51.99 to $60.71.
Robust capital flows persist despite negative price action
Baker Hughes reported no slowdown in investment for major energy projects and stated that higher borrowing costs have not negatively impacted capital commitments in the sector. The company also indicated that AI-related demand is contributing to ongoing investment in LNG and energy infrastructure. These factors were present, though price action has remained under broader selling pressure.
Bearish momentum confirmed as all signals align with downside
BKR has dropped decisively below its 20-day, 50-day, and 200-day moving averages at $62.96, $60.44, and $58.76, respectively. This points to firm selling pressure in the near and medium term, although the longer-term setup remains bullish due to the alignment of the 50-day and 200-day averages. The nearest resistance is the recent week low at $57.3, while support is noted at $51.99. Momentum indicators confirm weak sentiment: the Relative Strength Index (RSI) stands at 35.63, suggesting a 'Sell' signal. The MACD is negative at -0.22 and appears neutral. The ADX at 12.53 shows a lack of strong trend, and the Stochastic RSI, Commodity Channel Index (CCI), and Bull/Bear Power (BBP) all indicate oversold conditions, with BBP at -2.09 confirming dominant seller momentum. The Awesome Oscillator (AO) also reflects this negative bias. The stock closed near intraday lows with no recovery signals, and all major oscillators align with the bearish shift.
Earlier, analysts noted that Baker Hughes faced persistent selling pressure after near-term margin concerns and integration costs weighed on its outlook. The latest breakdown confirms that bearish technical momentum continues to dominate, making the $51.99 support a critical threshold for traders to monitor closely in the sessions ahead.






Latest Baker Hughes Co News





-
 Afghanistan
-
 Albania
-
 Algeria
-
 Angola
-
 Argentina
-
 Armenia
-
 Australia
-
 Austria
-
 Azerbaijan
-
 Bahamas
-
 Bahrain
-
 Bangladesh
-
 Belarus
-
 Belgium
-
 Bolivia
-
 Botswana
-
 Brazil
-
 Brunei
-
 Bulgaria
-
 Cambodia
-
 Cameroon
-
 Canada
-
 Chile
-
 China
-
 Colombia
-
 Congo
-
 Costa Rica
-
 Cote d'Ivoire
-
 Croatia
-
 Cuba
-
 Cyprus
-
 Czechia
-
 DR Congo
-
 Denmark
-
 Dominican Republic
-
 Ecuador
-
 Egypt
-
 El Salvador
-
 Estonia
-
 Eswatini
-
 Ethiopia
-
 Finland
-
 France
-
 Georgia
-
 Germany
-
 Ghana
-
 Greece
-
 Haiti
-
 Hong Kong
-
 Hungary
-
 India
-
 Indonesia
-
 Iran, Islamic republic
-
 Iraq
-
 Ireland
-
 Israel
-
 Italy
-
 Jamaica
-
 Japan
-
 Jordan
-
 Kazakhstan
-
 Kenya
-
 Korea
-
 Kuwait
-
 Kyrgyzstan
-
 Laos
-
 Latvia
-
 Lebanon
-
 Lesotho
-
 Libya
-
 Lithuania
-
 Luxembourg
-
 Madagascar
-
 Malaysia
-
 Malta
-
 Mauritius
-
 Mexico
-
 Moldova
-
 Mongolia
-
 Montenegro
-
 Morocco
-
 Mozambique
-
 Myanmar
-
 Namibia
-
 Nepal
-
 Netherlands
-
 New Zealand
-
 Nigeria
-
 North Macedonia
-
 Norway
-
 Oman
-
 Pakistan
-
 Palestine
-
 Panama
-
 Papua New Guinea
-
 Paraguay
-
 Peru
-
 Philippines
-
 Poland
-
 Portugal
-
 Puerto Rico
-
 Qatar
-
 Reunion
-
 Romania
-
 Rwanda
-
 Saudi Arabia
-
 Serbia
-
 Singapore
-
 Slovakia
-
 Slovenia
-
 Somalia
-
 South Africa
-
 Spain
-
 Sri Lanka
-
 Sweden
-
 Switzerland
-
 Syria
-
 Taiwan
-
 Tajikistan
-
 Tanzania
-
 Thailand
-
 Trinidad and Tobago
-
 Tunisia
-
 Turkey
-
 UAE
-
 Uganda
-
 Ukraine
-
 United Kingdom
-
United States
-
 Uruguay
-
 Uzbekistan
-
 Venezuela
-
 Vietnam
-
 Yemen
-
 Zambia
-
 Zimbabwe
- Forex
- Crypto












