

TELUS shares technical analysis: Consolidation near C$12.19 support

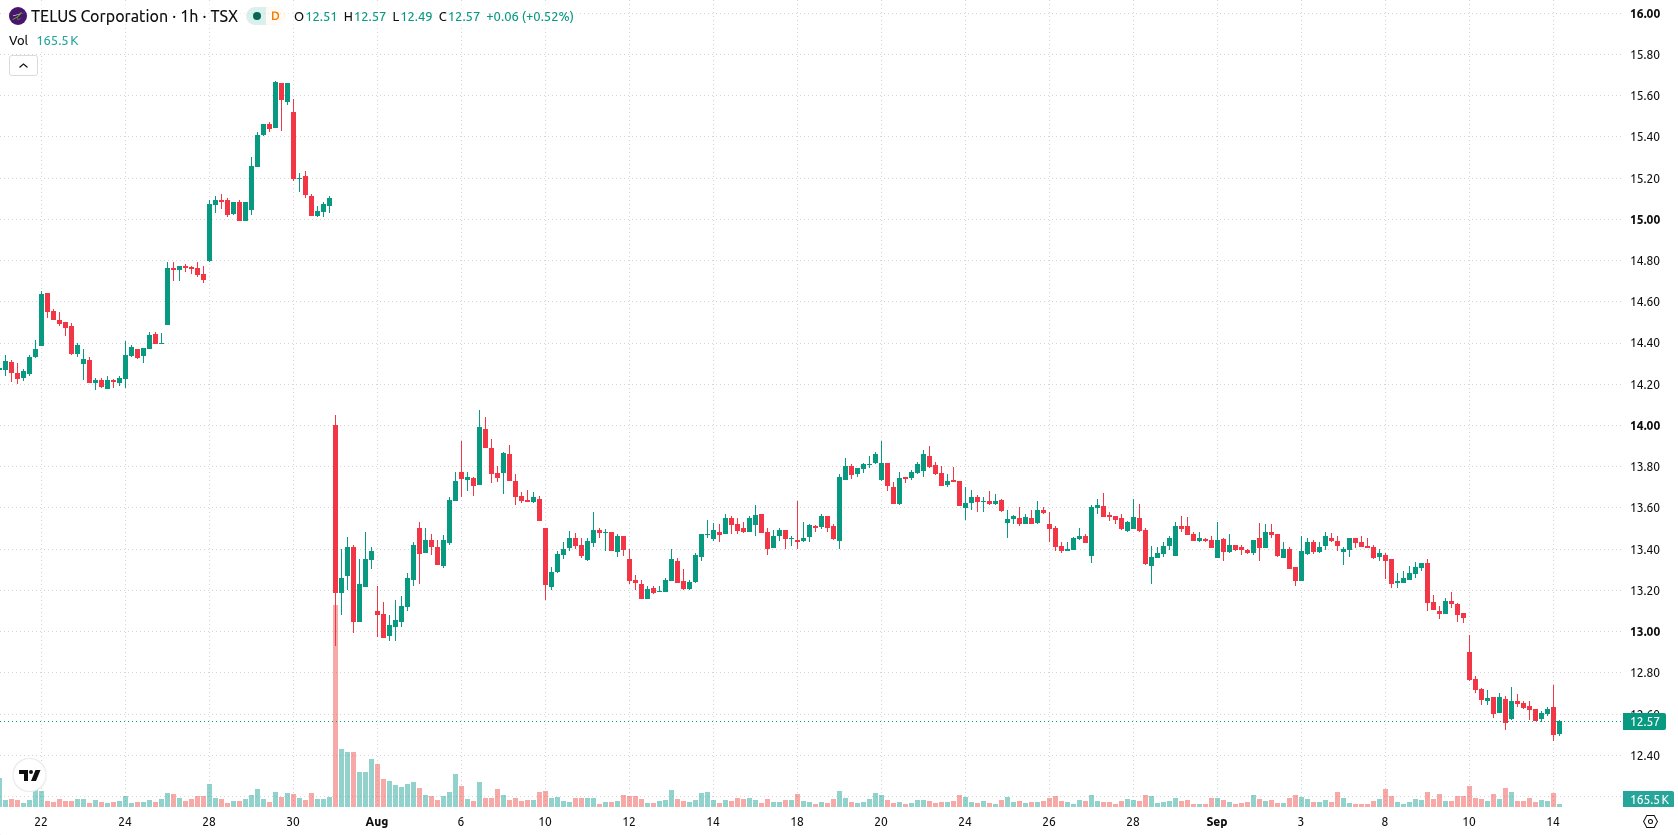
TELUS (T) stock is trading at C$12.57 with a slight intraday decline and remains below its key moving averages.
 12.30
12.65
Highlights
- Shares of TELUS currently trade below key short, medium, and long-term moving averages, confirming a broad downward trend.
- Bearish momentum dominates with strong sell signals from MACD and ADX, even as oscillators provide mixed signals.
- Expected trading range for the next several sessions is C$12.19 to C$12.95, with high probability for further downside if support fails.
Oscillator divergence deepens as momentum remains bearish
On the hourly chart, T is positioned below MA-20 at C$12.78 and MA-50 at C$13.13, while the daily chart shows a further drop below MA-200 at C$16.81. The Ichimoku Kijun acts as immediate resistance at C$12.93. Bearish momentum is confirmed by MACD on Strong Sell and ADX at Sell. RSI is low at 29.63, highlighting oversold conditions, whereas Stoch RSI indicates overbought and CCI remains on Sell—pointing to notable divergence among oscillators. Bull/Bear Power confirms active selling, and Awesome Oscillator is neutral.
Breakout risk shifts downward amid volatility and resistance
Looking ahead, T is expected to trade within a range of C$12.19 to C$12.95 over the next several sessions, consistent with current volatility. The probability of an upward breakout is considered very low, while the risk of further downside remains high. An upside reversal scenario would need a decisive move above C$12.93, while a fall below C$12.19 could open additional downside risk.
Earlier, analysts noted that TELUS faced persistent bearish pressure, with technical indicators suggesting heightened downside risk. The current analysis reinforces this view, highlighting the need to monitor the C$12.93 resistance and C$12.19 support as critical levels that could determine the next directional move.










-
 Afghanistan
-
 Albania
-
 Algeria
-
 Angola
-
 Argentina
-
 Armenia
-
 Australia
-
 Austria
-
 Azerbaijan
-
 Bahamas
-
 Bahrain
-
 Bangladesh
-
 Belarus
-
 Belgium
-
 Bolivia
-
 Botswana
-
 Brazil
-
 Brunei
-
 Bulgaria
-
 Cambodia
-
 Cameroon
-
 Canada
-
 Chile
-
 China
-
 Colombia
-
 Congo
-
 Costa Rica
-
 Cote d'Ivoire
-
 Croatia
-
 Cuba
-
 Cyprus
-
 Czechia
-
 DR Congo
-
 Denmark
-
 Dominican Republic
-
 Ecuador
-
 Egypt
-
 El Salvador
-
 Estonia
-
 Eswatini
-
 Ethiopia
-
 Finland
-
 France
-
 Georgia
-
 Germany
-
 Ghana
-
 Greece
-
 Haiti
-
 Hong Kong
-
 Hungary
-
 India
-
 Indonesia
-
 Iran, Islamic republic
-
 Iraq
-
 Ireland
-
 Israel
-
 Italy
-
 Jamaica
-
 Japan
-
 Jordan
-
 Kazakhstan
-
 Kenya
-
 Korea
-
 Kuwait
-
 Kyrgyzstan
-
 Laos
-
 Latvia
-
 Lebanon
-
 Lesotho
-
 Libya
-
 Lithuania
-
 Luxembourg
-
 Madagascar
-
 Malaysia
-
 Malta
-
 Mauritius
-
 Mexico
-
 Moldova
-
 Mongolia
-
 Montenegro
-
 Morocco
-
 Mozambique
-
 Myanmar
-
 Namibia
-
 Nepal
-
 Netherlands
-
 New Zealand
-
 Nigeria
-
 North Macedonia
-
 Norway
-
 Oman
-
 Pakistan
-
 Palestine
-
 Panama
-
 Papua New Guinea
-
 Paraguay
-
 Peru
-
 Philippines
-
 Poland
-
 Portugal
-
 Puerto Rico
-
 Qatar
-
 Reunion
-
 Romania
-
 Rwanda
-
 Saudi Arabia
-
 Serbia
-
 Singapore
-
 Slovakia
-
 Slovenia
-
 Somalia
-
 South Africa
-
 Spain
-
 Sri Lanka
-
 Sweden
-
 Switzerland
-
 Syria
-
 Taiwan
-
 Tajikistan
-
 Tanzania
-
 Thailand
-
 Trinidad and Tobago
-
 Tunisia
-
 Turkey
-
 UAE
-
 Uganda
-
 Ukraine
-
 United Kingdom
-
United States
-
 Uruguay
-
 Uzbekistan
-
 Venezuela
-
 Vietnam
-
 Yemen
-
 Zambia
-
 Zimbabwe
- Forex
- Crypto












