

Fidelity National Information Services stock resistance test: Breakout levels to watch

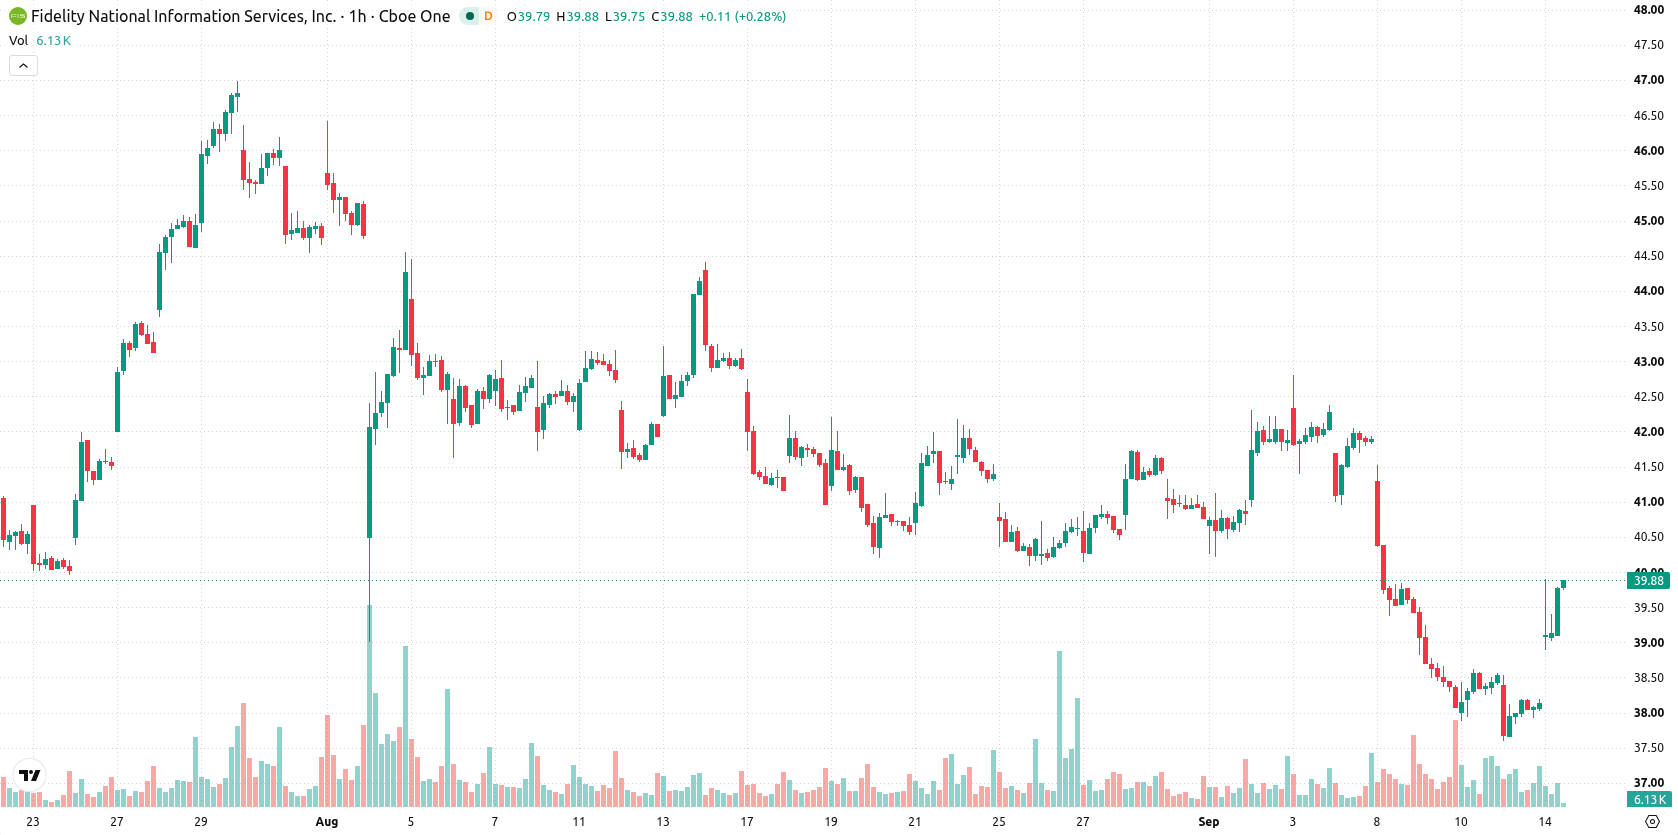
Fidelity National Information Services (FIS) stock is trading at $40.11, up 5.17% on the day. The price closed near the session high and is positioned above its key short- and medium-term moving averages but remains below the long-term average.
 34.32
34.45
34.32
34.45
Highlights
- California State Teachers Retirement System increased its holdings in Fidelity National Information Services by 3,634.9%, reaching 33,481,706 shares.
- This large institutional increase reduces available float and represents a significant position by a major pension fund.
- FIS stock is trading in a 38.56 to 41.66 range with bullish momentum short term but overbought signals and mixed technical outlooks.
Institutional buying accelerates as pension fund builds significant stake
A significant driver for FIS today is the disclosure that the California State Teachers Retirement System has raised its holdings in Fidelity National Information Services by 3,634.9%, now representing 33,481,706 shares according to MarketBeat. This sizable institutional acquisition injects considerable new demand into the market, often interpreted as a signal of long-term conviction from a major pension fund, and can stimulate further interest from other investors. The scale of this holding reduces available float and adds to positive sentiment around the stock’s prospects.
Short-term gains challenged by mixed signals and overbought momentum
Technically, FIS has cleared the MA-20 and MA-50 but continues to trade below the MA-200. The Ichimoku Kijun level at $38.75 stands as immediate support, while the expected range for the next several sessions is $38.56–$41.66. Momentum readings are conflicted: MACD remains at a strong sell, yet ADX indicates buyers are currently in control. The RSI reads 57.26, consistent with mild buying conditions, but both Stoch RSI and CCI are overbought, as is Bull/Bear Power, highlighting buyer dominance and signs of stretched short-term momentum. Awesome Oscillator is neutral.
Balanced outlook as range-bound trading follows major fund inflow
In the short term, FIS is likely to consolidate within the $38.56–$41.66 range. The forecast scenario is evenly balanced, with a 50% probability for both upward and downward moves. If resistance is breached, price could attempt the upper end of the range, while a break below support may prompt a retracement toward lower levels. Baseline expectation, however, is further sideways trading as the market digests recent institutional inflows and mixed technical signals.
Earlier, analysts noted that Fidelity National Information Services was experiencing persistent selling pressure and limited rebound potential within a sideways trading environment. The current analysis adds a new dimension by highlighting renewed institutional accumulation, which may tighten the stock’s float and introduce additional volatility risk around key technical levels as new positions are digested.











-
 Afghanistan
-
 Albania
-
 Algeria
-
 Angola
-
 Argentina
-
 Armenia
-
 Australia
-
 Austria
-
 Azerbaijan
-
 Bahamas
-
 Bahrain
-
 Bangladesh
-
 Belarus
-
 Belgium
-
 Bolivia
-
 Botswana
-
 Brazil
-
 Brunei
-
 Bulgaria
-
 Cambodia
-
 Cameroon
-
 Canada
-
 Chile
Chile
-
 China
China
-
 Colombia
-
 Congo
Congo
-
 Costa Rica
-
 Cote d'Ivoire
-
 Croatia
-
 Cuba
Cuba
-
 Cyprus
-
 Czechia
-
 DR Congo
-
 Denmark
-
 Dominican Republic
-
 Ecuador
-
 Egypt
Egypt
-
 El Salvador
-
 Estonia
-
 Eswatini
-
 Ethiopia
-
 Finland
-
 France
-
 Georgia
-
 Germany
-
 Ghana
Ghana
-
 Greece
-
 Haiti
Haiti
-
 Hong Kong
-
 Hungary
-
 India
India
-
 Indonesia
-
 Iran, Islamic republic
-
 Iraq
Iraq
-
 Ireland
-
 Israel
-
 Italy
Italy
-
 Jamaica
-
 Japan
Japan
-
 Jordan
-
 Kazakhstan
-
 Kenya
Kenya
-
 Korea
Korea
-
 Kuwait
-
 Kyrgyzstan
-
 Laos
Laos
-
 Latvia
-
 Lebanon
-
 Lesotho
-
 Libya
Libya
-
 Lithuania
-
 Luxembourg
-
 Madagascar
-
 Malaysia
-
 Malta
Malta
-
 Mauritius
-
 Mexico
-
 Moldova
-
 Mongolia
-
 Montenegro
-
 Morocco
-
 Mozambique
-
 Myanmar
-
 Namibia
-
 Nepal
Nepal
-
 Netherlands
-
 New Zealand
-
 Nigeria
-
 North Macedonia
-
 Norway
-
 Oman
Oman
-
 Pakistan
-
 Palestine
-
 Panama
-
 Papua New Guinea
-
 Paraguay
-
 Peru
Peru
-
 Philippines
-
 Poland
-
 Portugal
-
 Puerto Rico
-
 Qatar
Qatar
-
 Reunion
-
 Romania
-
 Rwanda
-
 Saudi Arabia
-
 Serbia
-
 Singapore
-
 Slovakia
-
 Slovenia
-
 Somalia
-
 South Africa
-
 Spain
Spain
-
 Sri Lanka
-
 Sweden
-
 Switzerland
-
 Syria
Syria
-
 Taiwan
-
 Tajikistan
-
 Tanzania
-
 Thailand
-
 Trinidad and Tobago
-
 Tunisia
-
 Turkey
-
 UAE
UAE
-
 Uganda
-
 Ukraine
-
 United Kingdom
-
United States
-
 Uruguay
-
 Uzbekistan
-
 Venezuela
-
 Vietnam
-
 Yemen
Yemen
-
 Zambia
-
 Zimbabwe
- Forex
- Crypto












