

ServiceNow shares technical analysis: Breakout attempt at $144.71 resistance after upbeat earnings

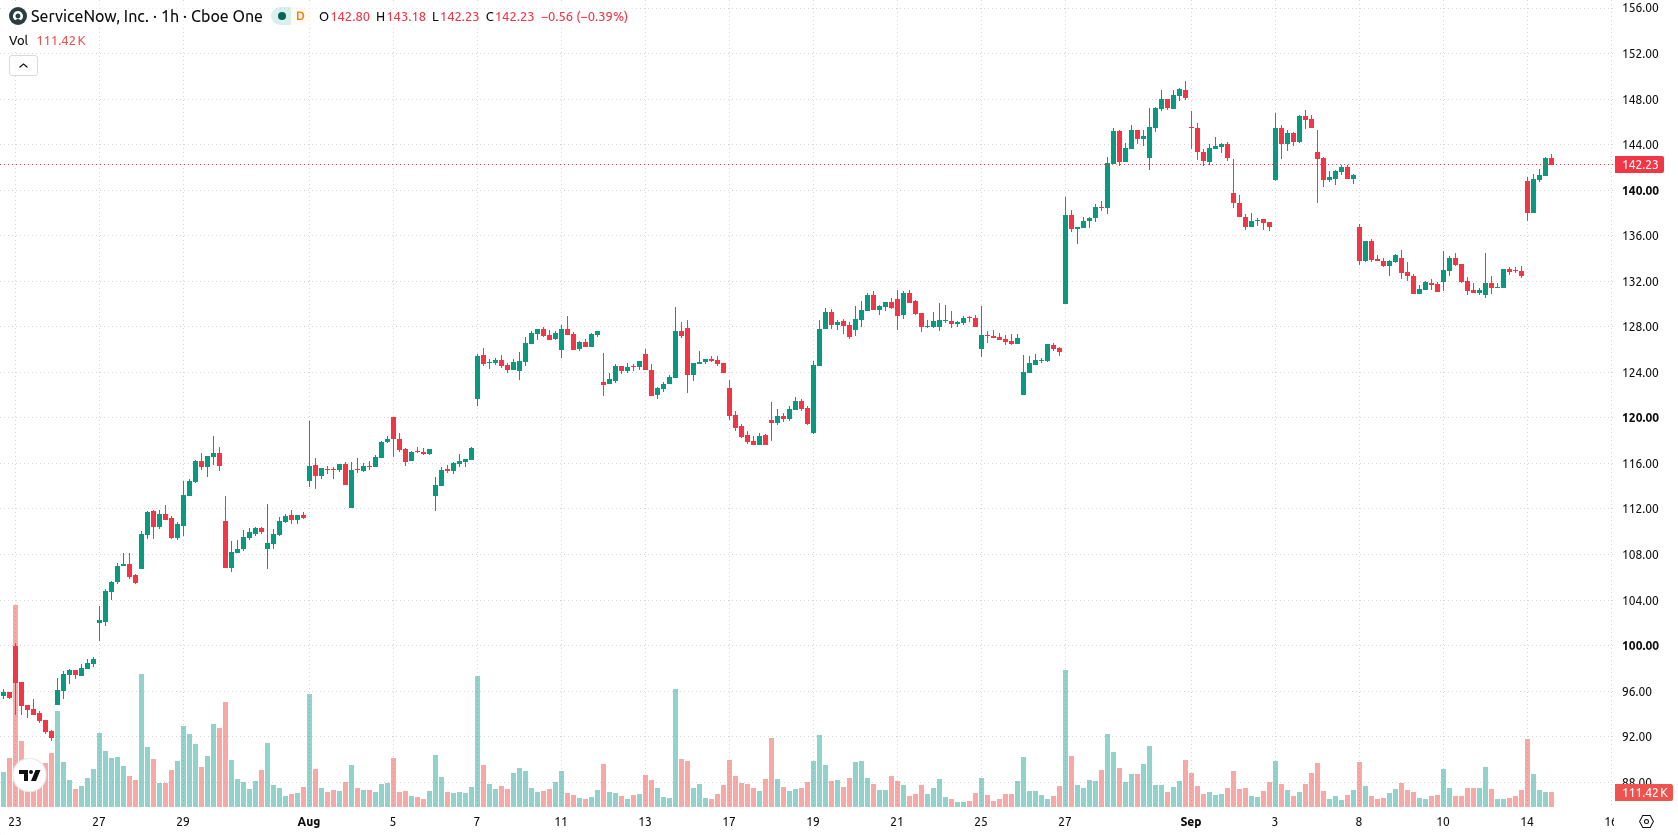
ServiceNow (NOW) stock is trading at $142.32, posting a 7.39% gain for the session. The price stands firmly above its key moving averages, indicating notable upward momentum over multiple timeframes.
 102.86
104.47
Highlights
- ServiceNow reported second quarter revenue of $3.99 billion, up 24% year over year, with EPS of $0.90, both exceeding analyst expectations.
- ServiceNow is partnering with Fortune to co-host an AI summit in October, aiming to expand its commercial AI business opportunities.
- Shares of ServiceNow surged 7.39% to $142.32, trading within a $140.1 to $144.71 expected range with moderate upward momentum and mixed technical signals.
Market optimism rises as revenue and earnings outpace forecasts
ServiceNow reported second quarter revenue of $3.99 billion, representing a 24% year-over-year increase, while earnings per share reached $0.90, both surpassing analyst expectations and highlighting robust demand for its core IT workflow platforms, according to 24/7 Wall St. This strong performance has elevated market interest in the company's growth outlook, as tangible financial beats often attract additional capital inflows. Separately, ServiceNow recently announced a partnership with Fortune to co-host an AI summit in October, positioning the company to deepen its role in advancing commercial artificial intelligence applications.
Mixed momentum signals amid elevated volatility and support above key averages
NOW/USD remains above the MA-20 ($132.12) and MA-50 ($136.51) on the H1 chart, as well as above the MA-200 ($117.98) on the daily timeframe. The Ichimoku Kijun sits at $133.08 and acts as immediate support beneath the current price. Momentum signals offer mixed readings: MACD shows strong selling, ADX is neutral, and RSI at 44.38 delivers a Sell signal, indicating momentum may be weakening. Stochastic RSI and Bull/Bear Power both indicate overbought intraday conditions with buyer dominance, CCI gives a buy read, and the Awesome Oscillator is neutral. Intraday volatility is elevated, and price diverges from several traditional momentum signals, signaling an ongoing contest between buyers and sellers.
Trading range expected as breakout and correction risks diverge
In the short term, NOW is expected to consolidate within a volatility band of $140.1 to $144.71. Probabilities favor further upside at 62%, while the chance of a down move stands at 38%. The baseline scenario assumes continued trading within this range. A breakout above the upper resistance could trigger additional gains, whereas a breach of Kijun support at $133.08 may open the way for a deeper correction.
Earlier, analysts noted that ServiceNow's strong earnings had prompted a shift toward consolidation at higher price levels, with key technical supports under watch for directional cues. The current setup adds depth by highlighting persistent volatility and mixed momentum signals, signaling traders should monitor $133.08 as a critical support level for any potential reversal.






Latest ServiceNow News




-
 Afghanistan
-
 Albania
-
 Algeria
-
 Angola
-
 Argentina
-
 Armenia
-
 Australia
-
 Austria
-
 Azerbaijan
-
 Bahamas
-
 Bahrain
-
 Bangladesh
-
 Belarus
-
 Belgium
-
 Bolivia
-
 Botswana
-
 Brazil
-
 Brunei
-
 Bulgaria
-
 Cambodia
-
 Cameroon
-
 Canada
-
 Chile
-
 China
-
 Colombia
-
 Congo
-
 Costa Rica
-
 Cote d'Ivoire
-
 Croatia
-
 Cuba
-
 Cyprus
-
 Czechia
-
 DR Congo
-
 Denmark
-
 Dominican Republic
-
 Ecuador
-
 Egypt
-
 El Salvador
-
 Estonia
-
 Eswatini
-
 Ethiopia
-
 Finland
-
 France
-
 Georgia
-
 Germany
-
 Ghana
-
 Greece
-
 Haiti
-
 Hong Kong
-
 Hungary
-
 India
-
 Indonesia
-
 Iran, Islamic republic
-
 Iraq
-
 Ireland
-
 Israel
-
 Italy
-
 Jamaica
-
 Japan
-
 Jordan
-
 Kazakhstan
-
 Kenya
-
 Korea
-
 Kuwait
-
 Kyrgyzstan
-
 Laos
-
 Latvia
-
 Lebanon
-
 Lesotho
-
 Libya
-
 Lithuania
-
 Luxembourg
-
 Madagascar
-
 Malaysia
-
 Malta
-
 Mauritius
-
 Mexico
-
 Moldova
-
 Mongolia
-
 Montenegro
-
 Morocco
-
 Mozambique
-
 Myanmar
-
 Namibia
-
 Nepal
-
 Netherlands
-
 New Zealand
-
 Nigeria
-
 North Macedonia
-
 Norway
-
 Oman
-
 Pakistan
-
 Palestine
-
 Panama
-
 Papua New Guinea
-
 Paraguay
-
 Peru
-
 Philippines
-
 Poland
-
 Portugal
-
 Puerto Rico
-
 Qatar
-
 Reunion
-
 Romania
-
 Rwanda
-
 Saudi Arabia
-
 Serbia
-
 Singapore
-
 Slovakia
-
 Slovenia
-
 Somalia
-
 South Africa
-
 Spain
-
 Sri Lanka
-
 Sweden
-
 Switzerland
-
 Syria
-
 Taiwan
-
 Tajikistan
-
 Tanzania
-
 Thailand
-
 Trinidad and Tobago
-
 Tunisia
-
 Turkey
-
 UAE
-
 Uganda
-
 Ukraine
-
 United Kingdom
-
United States
-
 Uruguay
-
 Uzbekistan
-
 Venezuela
-
 Vietnam
-
 Yemen
-
 Zambia
-
 Zimbabwe
- Forex
- Crypto












