

Resistance test approaches: Can NNDM break mid-range resistance soon?

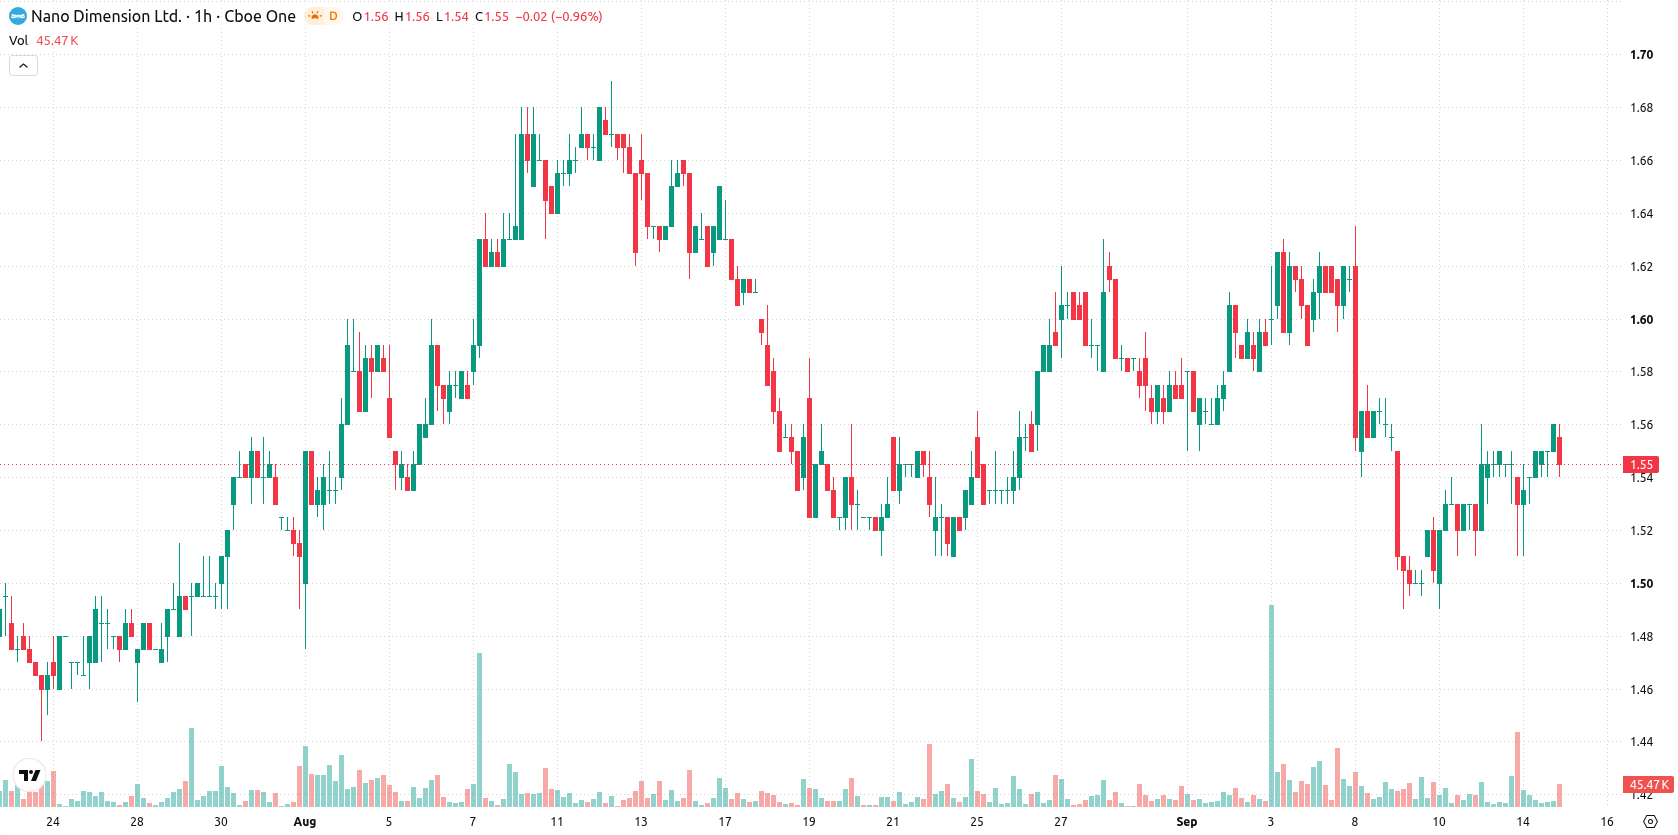
Nano Dimension (NNDM) stock is trading at $1.54 with a modest move higher on the day, showing a slight gain within a moderate intraday range. The price currently sits above its short-term averages but is still below medium- and long-term trend levels, reflecting a mixed technical posture.
 1.28
1.38
Highlights
- NNDM/USD trades above the 20-day moving average but remains below both the 50-day and 200-day moving averages, indicating continued medium- and long-term selling pressure.
- Momentum indicators are mixed, with buyers showing some intraday strength but overall trend direction remains uncertain due to contradictory oscillator signals.
- Forecast range for the next 2 to 3 trading days is $1.47 to $1.61, with a very high probability of a downside move and limited upside potential.
Contradictory momentum signals amid mixed moving average structure
NNDM is trading above the MA-20 but remains beneath both the MA-50 and MA-200, with technical support appearing at the Ichimoku Kijun level of $1.53. MACD is showing a neutral stance, while ADX indicates sellers retain an advantage at present levels. The RSI reads 47.95, signaling a sell bias, whereas CCI and Bull/Bear Power both point to emerging buyer strength. However, Stoch RSI reflects clear downside momentum, while the Awesome Oscillator supports buyers—underscoring the mixed and contradictory signals from current momentum indicators.
Downside risk predominates as buyers face resistance
The price forecast for the next 2-3 trading days sees NNDM likely fluctuating in the $1.47 to $1.61 range, with sideways action as the base case. There is a very high likelihood of a downward move, with limited probability of an upward breakout. Buyers would require a clear push above mid-range resistance to shift the outlook, while a failure at immediate support could bring further downside below $1.53.
Earlier, analysts noted that Nano Dimension was exhibiting ongoing bearish momentum with limited signs of a sustained recovery. The current analysis underscores this cautious view, highlighting that traders should monitor for a decisive move above resistance or below support to signal a clear directional shift in the coming sessions.






Latest Nano Dimension News




-
 Afghanistan
-
 Albania
-
 Algeria
-
 Angola
-
 Argentina
-
 Armenia
-
 Australia
-
 Austria
-
 Azerbaijan
-
 Bahamas
-
 Bahrain
-
 Bangladesh
-
 Belarus
-
 Belgium
-
 Bolivia
-
 Botswana
-
 Brazil
-
 Brunei
-
 Bulgaria
-
 Cambodia
-
 Cameroon
-
 Canada
-
 Chile
-
 China
-
 Colombia
-
 Congo
-
 Costa Rica
-
 Cote d'Ivoire
-
 Croatia
-
 Cuba
-
 Cyprus
-
 Czechia
-
 DR Congo
-
 Denmark
-
 Dominican Republic
-
 Ecuador
-
 Egypt
-
 El Salvador
-
 Estonia
-
 Eswatini
-
 Ethiopia
-
 Finland
-
 France
-
 Georgia
-
 Germany
-
 Ghana
-
 Greece
-
 Haiti
-
 Hong Kong
-
 Hungary
-
 India
-
 Indonesia
-
 Iran, Islamic republic
-
 Iraq
-
 Ireland
-
 Israel
-
 Italy
-
 Jamaica
-
 Japan
-
 Jordan
-
 Kazakhstan
-
 Kenya
-
 Korea
-
 Kuwait
-
 Kyrgyzstan
-
 Laos
-
 Latvia
-
 Lebanon
-
 Lesotho
-
 Libya
-
 Lithuania
-
 Luxembourg
-
 Madagascar
-
 Malaysia
-
 Malta
-
 Mauritius
-
 Mexico
-
 Moldova
-
 Mongolia
-
 Montenegro
-
 Morocco
-
 Mozambique
-
 Myanmar
-
 Namibia
-
 Nepal
-
 Netherlands
-
 New Zealand
-
 Nigeria
-
 North Macedonia
-
 Norway
-
 Oman
-
 Pakistan
-
 Palestine
-
 Panama
-
 Papua New Guinea
-
 Paraguay
-
 Peru
-
 Philippines
-
 Poland
-
 Portugal
-
 Puerto Rico
-
 Qatar
-
 Reunion
-
 Romania
-
 Rwanda
-
 Saudi Arabia
-
 Serbia
-
 Singapore
-
 Slovakia
-
 Slovenia
-
 Somalia
-
 South Africa
-
 Spain
-
 Sri Lanka
-
 Sweden
-
 Switzerland
-
 Syria
-
 Taiwan
-
 Tajikistan
-
 Tanzania
-
 Thailand
-
 Trinidad and Tobago
-
 Tunisia
-
 Turkey
-
 UAE
-
 Uganda
-
 Ukraine
-
 United Kingdom
-
United States
-
 Uruguay
-
 Uzbekistan
-
 Venezuela
-
 Vietnam
-
 Yemen
-
 Zambia
-
 Zimbabwe
- Forex
- Crypto












