

IREN stock falls around 4.5% as bearish trend persists despite new AI partnerships

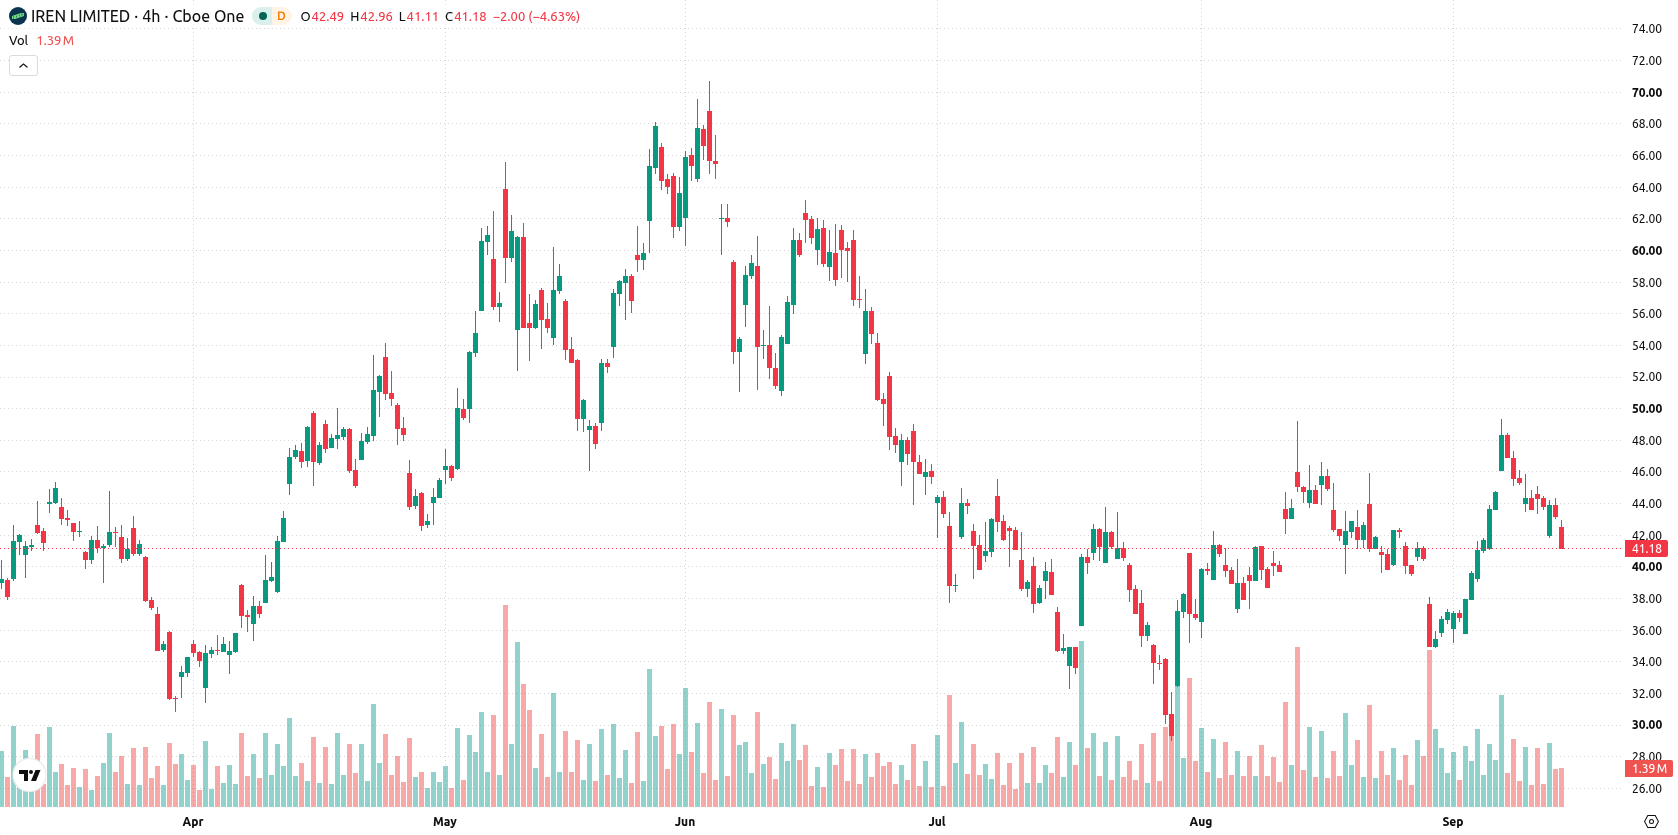
IREN Limited (IREN) dropped 4.51% after the open, as selling pressure returned even as the company reported a series of high-profile partnerships and facility approvals. The decline is supported by the stock trading below both its 20-day and 200-day moving averages, confirming lingering long-term bearish pressure and resistance near the technical ceiling.
 17.10
21.64
Highlights
- IREN secured a multi-billion-dollar partnership with Nvidia and new AI infrastructure agreements, expanding its AI Cloud Services business.
- The company projects annual recurring revenue of $4 billion by end of 2026 and received conditional approval for major Texas data centers.
- Shares of IREN fell 4.51% to $41.23, trading below key moving averages with mixed momentum and an expected range of $38.63 to $43.83 over five days.
Growth deals countered by net loss and persistent market skepticism
IREN secured a multi-billion-dollar partnership with Nvidia and announced new agreements in the AI infrastructure sector. The company reported growth in its AI Cloud Services unit, including contracts with Microsoft and multiple AI startups, and projected annual recurring revenue of $4 billion by the end of 2026. Conditional approval was granted for its Sweetwater 1 and 2 data centers in Texas under ERCOT's Batch Zero process. These developments occurred amid a reported net loss attributed to noncash asset impairments, though price action has remained under broader selling pressure.
Bearish long-term structure as momentum and signals diverge
IREN is trading below its 20-day moving average ($41.74) and 200-day moving average ($45.63), but remains above its 50-day moving average ($40.27), which points to ongoing short-term support amid medium-term strength and lingering longer-term pressure from sellers. The nearest resistance is at $41.74 and support at $40.27, with the Ichimoku Kijun ($42.04) acting as additional resistance. The alignment between the 50-day and 200-day moving averages confirms a bearish long-term trend structure. Momentum signals are mixed. The MACD suggests upward pressure, while the ADX is neutral, indicating a weak trend. The RSI points to slight buy bias, with the Stochastic RSI and CCI both neutral. Bull/Bear Power is positive, indicating intraday buying dominance, though flagged as overbought. The Awesome Oscillator is neutral.
Earlier, analysts noted that despite Iris Energy’s pivot to AI infrastructure and high-profile contract wins, technical and market headwinds continued to weigh on the stock’s outlook. The current analysis confirms this assessment, highlighting a persistent bearish long-term trend and volatility risks, with traders advised to monitor the $40.27–$41.74 band for directional cues in the days ahead.






Latest IREN Limited News



-
 Afghanistan
-
 Albania
-
 Algeria
-
 Angola
-
 Argentina
-
 Armenia
-
 Australia
-
 Austria
-
 Azerbaijan
-
 Bahamas
-
 Bahrain
-
 Bangladesh
-
 Belarus
-
 Belgium
-
 Bolivia
-
 Botswana
-
 Brazil
-
 Brunei
-
 Bulgaria
-
 Cambodia
-
 Cameroon
-
 Canada
-
 Chile
-
 China
-
 Colombia
-
 Congo
-
 Costa Rica
-
 Cote d'Ivoire
-
 Croatia
-
 Cuba
-
 Cyprus
-
 Czechia
-
 DR Congo
-
 Denmark
-
 Dominican Republic
-
 Ecuador
-
 Egypt
-
 El Salvador
-
 Estonia
-
 Eswatini
-
 Ethiopia
-
 Finland
-
 France
-
 Georgia
-
 Germany
-
 Ghana
-
 Greece
-
 Haiti
-
 Hong Kong
-
 Hungary
-
 India
-
 Indonesia
-
 Iran, Islamic republic
-
 Iraq
-
 Ireland
-
 Israel
-
 Italy
-
 Jamaica
-
 Japan
-
 Jordan
-
 Kazakhstan
-
 Kenya
-
 Korea
-
 Kuwait
-
 Kyrgyzstan
-
 Laos
-
 Latvia
-
 Lebanon
-
 Lesotho
-
 Libya
-
 Lithuania
-
 Luxembourg
-
 Madagascar
-
 Malaysia
-
 Malta
-
 Mauritius
-
 Mexico
-
 Moldova
-
 Mongolia
-
 Montenegro
-
 Morocco
-
 Mozambique
-
 Myanmar
-
 Namibia
-
 Nepal
-
 Netherlands
-
 New Zealand
-
 Nigeria
-
 North Macedonia
-
 Norway
-
 Oman
-
 Pakistan
-
 Palestine
-
 Panama
-
 Papua New Guinea
-
 Paraguay
-
 Peru
-
 Philippines
-
 Poland
-
 Portugal
-
 Puerto Rico
-
 Qatar
-
 Reunion
-
 Romania
-
 Rwanda
-
 Saudi Arabia
-
 Serbia
-
 Singapore
-
 Slovakia
-
 Slovenia
-
 Somalia
-
 South Africa
-
 Spain
-
 Sri Lanka
-
 Sweden
-
 Switzerland
-
 Syria
-
 Taiwan
-
 Tajikistan
-
 Tanzania
-
 Thailand
-
 Trinidad and Tobago
-
 Tunisia
-
 Turkey
-
 UAE
-
 Uganda
-
 Ukraine
-
 United Kingdom
-
United States
-
 Uruguay
-
 Uzbekistan
-
 Venezuela
-
 Vietnam
-
 Yemen
-
 Zambia
-
 Zimbabwe
- Forex
- Crypto












