

Intuit stock falls over 2% as shares face selling despite strong earnings and buyback plans

Intuit Inc. (INTU) declined 2.04% as a bout of selling followed recent positive corporate developments, even as robust Q4 FY2026 results, a dividend hike, and expanded buyback authorization underscored management's proactive approach. The move is constrained by the stock remaining below both its 20-day and 200-day moving averages, with resistance forming at short- and long-term trend levels.
 343.92
343.57
Highlights
- Intuit reported Q4 FY2026 adjusted earnings per share of $4.03 and full-year revenue rising 14% to $21.45 billion.
- The company raised its quarterly dividend by 15% to $1.38 per share, repurchased $5.5 billion in stock, and authorized an additional $7.9 billion for future buybacks.
- Shares of Intuit trade below short- and long-term moving averages with muted intraday volatility, holding in a $329.49 to $336.55 range and a 68% probability of staying sideways or moving higher over the next week.
Buybacks and dividend hike meet persistent selling despite strong results
Intuit reported stronger-than-expected Q4 FY2026 earnings with adjusted earnings per share of $4.03 and a 14% rise in full-year revenue to $21.45 billion. The company increased its quarterly dividend by approximately 15% to $1.38 per share and completed $5.5 billion in share repurchases during fiscal 2026, authorizing an additional $7.9 billion for future buybacks. Fiscal 2027 guidance projected 9–10% revenue growth and the company will present its AI-focused growth strategy at the Investor Day on September 17, 2026. Payments revenue also recorded a $257 million year-over-year increase, with online payment volume up 32% in Q4 FY2026, though price action has remained under broader selling pressure.
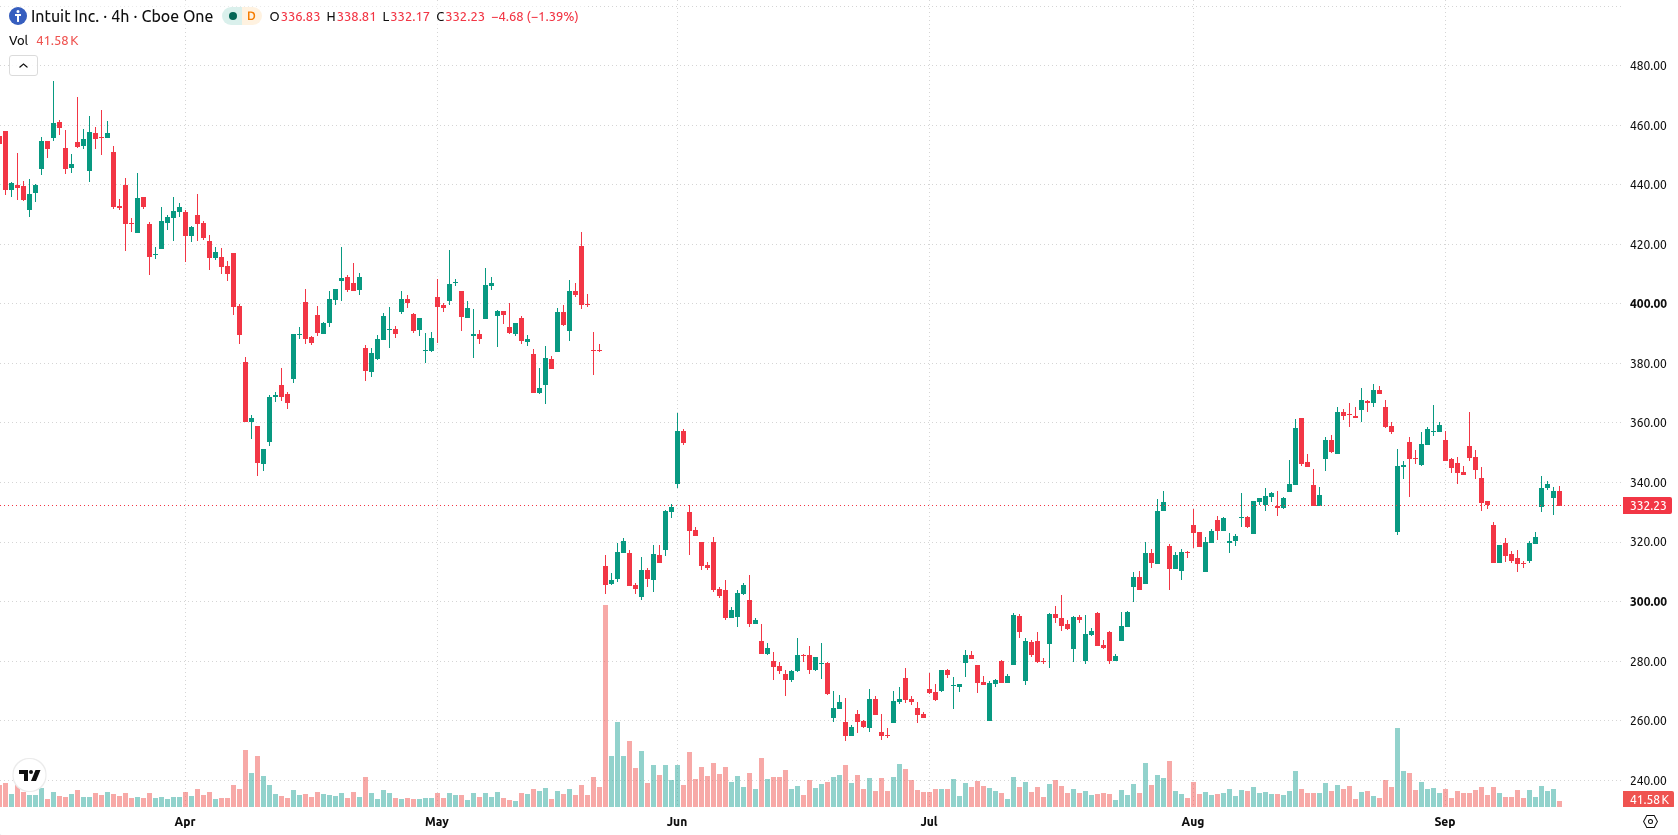
Mixed momentum and resistance defined as price holds interim support
Intuit is trading below its 20-day moving average ($344.29) and 200-day moving average ($419), but remains above the 50-day moving average ($321.03). This configuration suggests pressure from sellers on short- and long-term trends, with the medium-term structure still intact above immediate support. The Ichimoku Kijun ($341.62) serves as resistance, while the nearest support stands at $329.49 and resistance at $336.55. Momentum readings are mixed: the MACD and Average Directional Index are neutral, the RSI at 52.55 signals a 'Buy' but is not overbought or oversold, and Bull/Bear Power is positive at 6.81, indicating buyers dominate intraday action. The Awesome Oscillator flashes a 'Sell' reading, diverging from short-term bullish signals. Intraday trading has been mid-range, with subdued volatility at 2.14% and sideways price action reflecting mixed sentiment.
Previously it was reported that Intuit's strong financial results and increased shareholder returns could support continued momentum, while also cautioning that near-term consolidation was possible. The current analysis adds that, despite robust earnings and buybacks, persistent resistance and mixed technical signals place emphasis on whether Intuit can firmly hold above $329.49 in the coming sessions to avoid testing the lower end of its forecasted trading band.










-
 Afghanistan
-
 Albania
-
 Algeria
-
 Angola
-
 Argentina
-
 Armenia
-
 Australia
-
 Austria
-
 Azerbaijan
-
 Bahamas
-
 Bahrain
-
 Bangladesh
-
 Belarus
-
 Belgium
-
 Bolivia
-
 Botswana
-
 Brazil
-
 Brunei
-
 Bulgaria
-
 Cambodia
-
 Cameroon
-
 Canada
-
 Chile
-
 China
-
 Colombia
-
 Congo
-
 Costa Rica
-
 Cote d'Ivoire
-
 Croatia
-
 Cuba
-
 Cyprus
-
 Czechia
-
 DR Congo
-
 Denmark
-
 Dominican Republic
-
 Ecuador
-
 Egypt
-
 El Salvador
-
 Estonia
-
 Eswatini
-
 Ethiopia
-
 Finland
-
 France
-
 Georgia
-
 Germany
-
 Ghana
-
 Greece
-
 Haiti
-
 Hong Kong
-
 Hungary
-
 India
-
 Indonesia
-
 Iran, Islamic republic
-
 Iraq
-
 Ireland
-
 Israel
-
 Italy
-
 Jamaica
-
 Japan
-
 Jordan
-
 Kazakhstan
-
 Kenya
-
 Korea
-
 Kuwait
-
 Kyrgyzstan
-
 Laos
-
 Latvia
-
 Lebanon
-
 Lesotho
-
 Libya
-
 Lithuania
-
 Luxembourg
-
 Madagascar
-
 Malaysia
-
 Malta
-
 Mauritius
-
 Mexico
-
 Moldova
-
 Mongolia
-
 Montenegro
-
 Morocco
-
 Mozambique
-
 Myanmar
-
 Namibia
-
 Nepal
-
 Netherlands
-
 New Zealand
-
 Nigeria
-
 North Macedonia
-
 Norway
-
 Oman
-
 Pakistan
-
 Palestine
-
 Panama
-
 Papua New Guinea
-
 Paraguay
-
 Peru
-
 Philippines
-
 Poland
-
 Portugal
-
 Puerto Rico
-
 Qatar
-
 Reunion
-
 Romania
-
 Rwanda
-
 Saudi Arabia
-
 Serbia
-
 Singapore
-
 Slovakia
-
 Slovenia
-
 Somalia
-
 South Africa
-
 Spain
-
 Sri Lanka
-
 Sweden
-
 Switzerland
-
 Syria
-
 Taiwan
-
 Tajikistan
-
 Tanzania
-
 Thailand
-
 Trinidad and Tobago
-
 Tunisia
-
 Turkey
-
 UAE
-
 Uganda
-
 Ukraine
-
 United Kingdom
-
United States
-
 Uruguay
-
 Uzbekistan
-
 Venezuela
-
 Vietnam
-
 Yemen
-
 Zambia
-
 Zimbabwe
- Forex
- Crypto












