


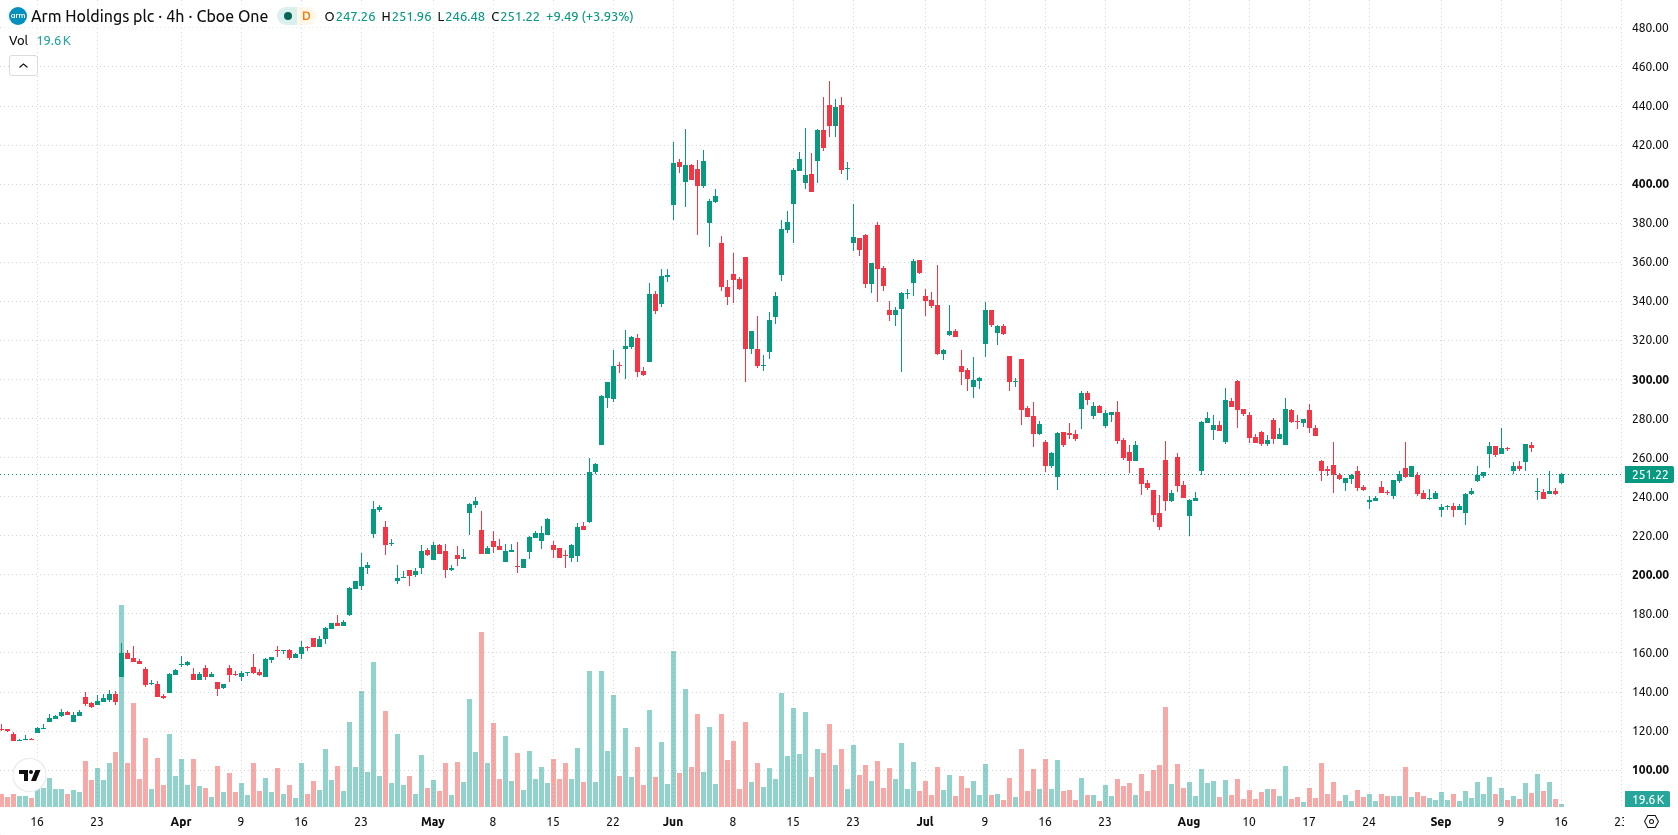
Arm Holdings (ARM) jumped 3.02% as renewed investor interest and strong annual financial results reignited demand for the stock. The up move shows some limitations, with Arm trading above its 20- and 200-day moving averages but still encountering medium-term resistance near the 50-day average.
 184.56
207.31
Highlights
- Arm stock has risen as investors focus on robust royalty streams and solid annual earnings performance.
- Smartphone chip royalties anchor business fundamentals, but some still question current valuation levels.
- Arm stock trades above key long-term averages near $249.13, but mixed momentum signals indicate consolidation between $234.37 and $263.88 with a high probability of a downward move.
Royalty-driven optimism lifts sentiment amid caution on valuation risks
Arm's recent rise has been driven by renewed investor focus on its ongoing royalty streams and strong annual earnings. Trading volumes have decreased from average levels in recent sessions. The company's stable business fundamentals are supported by royalties from smartphone chip shipments, though some market participants remain cautious about current valuation levels.
Bullish price structure contrasts with weakening momentum at resistance
Arm is trading above its 20-day ($247.7) and 200-day ($205.38) moving averages, but remains below the 50-day ($263.94), indicating a bullish structure on the short- and long-term horizons with some medium-term weakness. The nearest resistance aligns with the Ichimoku Kijun at $257.86, while support rests at the 20-day moving average at $247.7. Momentum signals are mixed: the MACD and Awesome Oscillator both indicate strong selling pressure, while the ADX shows a weak or indecisive trend. The RSI and CCI point to neutral to mild selling, with neither suggesting an oversold or overbought condition. Bull/Bear Power shows buyers dominating intraday action, but its overbought reading warns of limited upside in the very short term. Arm is trading at $249.13 following an upside gap and a daily gain of 3.02%, with volatility muted at 0.28% and prices near session highs. However, several momentum indicators and oscillators are not aligned with today's strong price action, highlighting a notable divergence as the stock advances into resistance.
Earlier, analysts noted that Arm's solid revenue growth and earnings were overshadowed by persistent technical weakness and valuation concerns, resulting in a mostly sideways outlook. The current analysis adds that, despite a recent upward move above short- and long-term averages, mixed momentum signals and declining volumes suggest traders should closely watch the $257.86 resistance for any confirmation of sustained upside beyond the prevailing consolidation zone.










-
 Afghanistan
-
 Albania
-
 Algeria
-
 Angola
-
 Argentina
-
 Armenia
-
 Australia
-
 Austria
-
 Azerbaijan
-
 Bahamas
-
 Bahrain
-
 Bangladesh
-
 Belarus
-
 Belgium
-
 Bolivia
-
 Botswana
-
 Brazil
-
 Brunei
-
 Bulgaria
-
 Cambodia
-
 Cameroon
-
 Canada
-
 Chile
-
 China
-
 Colombia
-
 Congo
-
 Costa Rica
-
 Cote d'Ivoire
-
 Croatia
-
 Cuba
-
 Cyprus
-
 Czechia
-
 DR Congo
-
 Denmark
-
 Dominican Republic
-
 Ecuador
-
 Egypt
-
 El Salvador
-
 Estonia
-
 Eswatini
-
 Ethiopia
-
 Finland
-
 France
-
 Georgia
-
 Germany
-
 Ghana
-
 Greece
-
 Haiti
-
 Hong Kong
-
 Hungary
-
 India
-
 Indonesia
-
 Iran, Islamic republic
-
 Iraq
-
 Ireland
-
 Israel
-
 Italy
-
 Jamaica
-
 Japan
-
 Jordan
-
 Kazakhstan
-
 Kenya
-
 Korea
-
 Kuwait
-
 Kyrgyzstan
-
 Laos
-
 Latvia
-
 Lebanon
-
 Lesotho
-
 Libya
-
 Lithuania
-
 Luxembourg
-
 Madagascar
-
 Malaysia
-
 Malta
-
 Mauritius
-
 Mexico
-
 Moldova
-
 Mongolia
-
 Montenegro
-
 Morocco
-
 Mozambique
-
 Myanmar
-
 Namibia
-
 Nepal
-
 Netherlands
-
 New Zealand
-
 Nigeria
-
 North Macedonia
-
 Norway
-
 Oman
-
 Pakistan
-
 Palestine
-
 Panama
-
 Papua New Guinea
-
 Paraguay
-
 Peru
-
 Philippines
-
 Poland
-
 Portugal
-
 Puerto Rico
-
 Qatar
-
 Reunion
-
 Romania
-
 Rwanda
-
 Saudi Arabia
-
 Serbia
-
 Singapore
-
 Slovakia
-
 Slovenia
-
 Somalia
-
 South Africa
-
 Spain
-
 Sri Lanka
-
 Sweden
-
 Switzerland
-
 Syria
-
 Taiwan
-
 Tajikistan
-
 Tanzania
-
 Thailand
-
 Trinidad and Tobago
-
 Tunisia
-
 Turkey
-
 UAE
-
 Uganda
-
 Ukraine
-
 United Kingdom
-
United States
-
 Uruguay
-
 Uzbekistan
-
 Venezuela
-
 Vietnam
-
 Yemen
-
 Zambia
-
 Zimbabwe
- Forex
- Crypto












