

Support test at $132.99: Can ConocoPhillips stock avoid deeper losses?

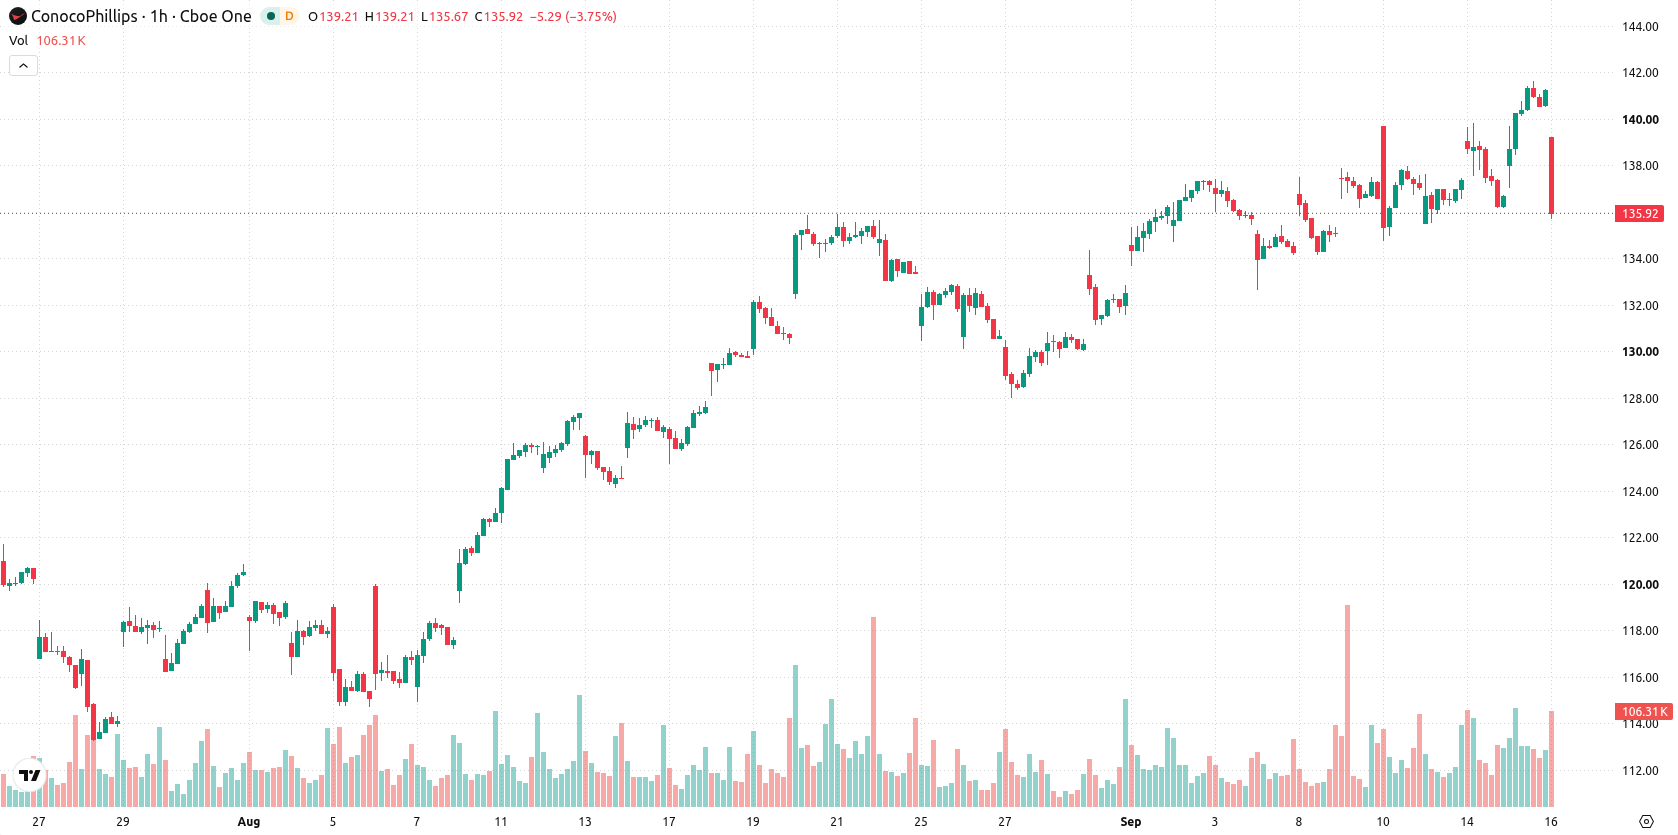
ConocoPhillips (COP) stock is trading at $136, marking a daily decline of 3.7%. The price sits below its key short- and medium-term moving averages, with near-term momentum pointing lower while the longer-term trend remains intact.
 154.21
Highlights
- COP/USD trades below key short- and medium-term moving averages, indicating continued downside pressure in the near term.
- Momentum indicators show conflicting signals, with strong buy readings from MACD and ADX but oversold or weak signals from RSI and Stoch RSI.
- Price is forecast to fluctuate between $132.99 and $139.01 in the next sessions, with equal probability for further upside or downside.
Volatility and indecision as mixed signals follow technical breach
COP is currently below the MA-20 at $138.39 and MA-50 at $136.92 on the hourly chart, with the MA-200 providing longer-term support at $114.22 on the daily timeframe. Immediate resistance is defined by the Ichimoku Kijun level at $138.57, while forecast support sits at $132.99. On the momentum side, the MACD and ADX both flash buy signals indicating underlying strength, but the RSI stands at 42.53 (in sell territory) and the Stochastic RSI is oversold, reflecting short-term exhaustion. Mixed readings from indicators, with Bull/Bear Power signaling seller dominance and CCI subdued, suggest an environment characterized by volatility and market indecision near today's lows.
Sideways range predicted as breakout triggers remain in play
In the near term, COP is expected to trade within a range of $132.99 to $139.01, with probabilities for both upward and downward moves set at 50%. The base scenario calls for continued sideways movement within this corridor. A confirmed breakout above $138.57 could trigger renewed bullish momentum, while a break below $132.99 would likely signal additional near-term downside within the prevailing volatility band.
In a recent review, ConocoPhillips stock was highlighted for its robust short-term momentum and prevailing bullish technical outlook. The latest shift to mixed technical signals and increased volatility introduces a more neutral scenario for traders, making sustained moves above or below the current range key markers for the next directional trend.











-
 Afghanistan
-
 Albania
-
 Algeria
-
 Angola
-
 Argentina
-
 Armenia
-
 Australia
-
 Austria
-
 Azerbaijan
-
 Bahamas
-
 Bahrain
-
 Bangladesh
-
 Belarus
-
 Belgium
-
 Bolivia
-
 Botswana
-
 Brazil
-
 Brunei
-
 Bulgaria
-
 Cambodia
-
 Cameroon
-
 Canada
-
 Chile
-
 China
-
 Colombia
-
 Congo
-
 Costa Rica
-
 Cote d'Ivoire
-
 Croatia
-
 Cuba
-
 Cyprus
-
 Czechia
-
 DR Congo
-
 Denmark
-
 Dominican Republic
-
 Ecuador
-
 Egypt
-
 El Salvador
-
 Estonia
-
 Eswatini
-
 Ethiopia
-
 Finland
-
 France
-
 Georgia
-
 Germany
-
 Ghana
-
 Greece
-
 Haiti
-
 Hong Kong
-
 Hungary
-
 India
-
 Indonesia
-
 Iran, Islamic republic
-
 Iraq
-
 Ireland
-
 Israel
-
 Italy
-
 Jamaica
-
 Japan
-
 Jordan
-
 Kazakhstan
-
 Kenya
-
 Korea
-
 Kuwait
-
 Kyrgyzstan
-
 Laos
-
 Latvia
-
 Lebanon
-
 Lesotho
-
 Libya
-
 Lithuania
-
 Luxembourg
-
 Madagascar
-
 Malaysia
-
 Malta
-
 Mauritius
-
 Mexico
-
 Moldova
-
 Mongolia
-
 Montenegro
-
 Morocco
-
 Mozambique
-
 Myanmar
-
 Namibia
-
 Nepal
-
 Netherlands
-
 New Zealand
-
 Nigeria
-
 North Macedonia
-
 Norway
-
 Oman
-
 Pakistan
-
 Palestine
-
 Panama
-
 Papua New Guinea
-
 Paraguay
-
 Peru
-
 Philippines
-
 Poland
-
 Portugal
-
 Puerto Rico
-
 Qatar
-
 Reunion
-
 Romania
-
 Rwanda
-
 Saudi Arabia
-
 Serbia
-
 Singapore
-
 Slovakia
-
 Slovenia
-
 Somalia
-
 South Africa
-
 Spain
-
 Sri Lanka
-
 Sweden
-
 Switzerland
-
 Syria
-
 Taiwan
-
 Tajikistan
-
 Tanzania
-
 Thailand
-
 Trinidad and Tobago
-
 Tunisia
-
 Turkey
-
 UAE
-
 Uganda
-
 Ukraine
-
 United Kingdom
-
United States
-
 Uruguay
-
 Uzbekistan
-
 Venezuela
-
 Vietnam
-
 Yemen
-
 Zambia
-
 Zimbabwe
- Forex
- Crypto












