


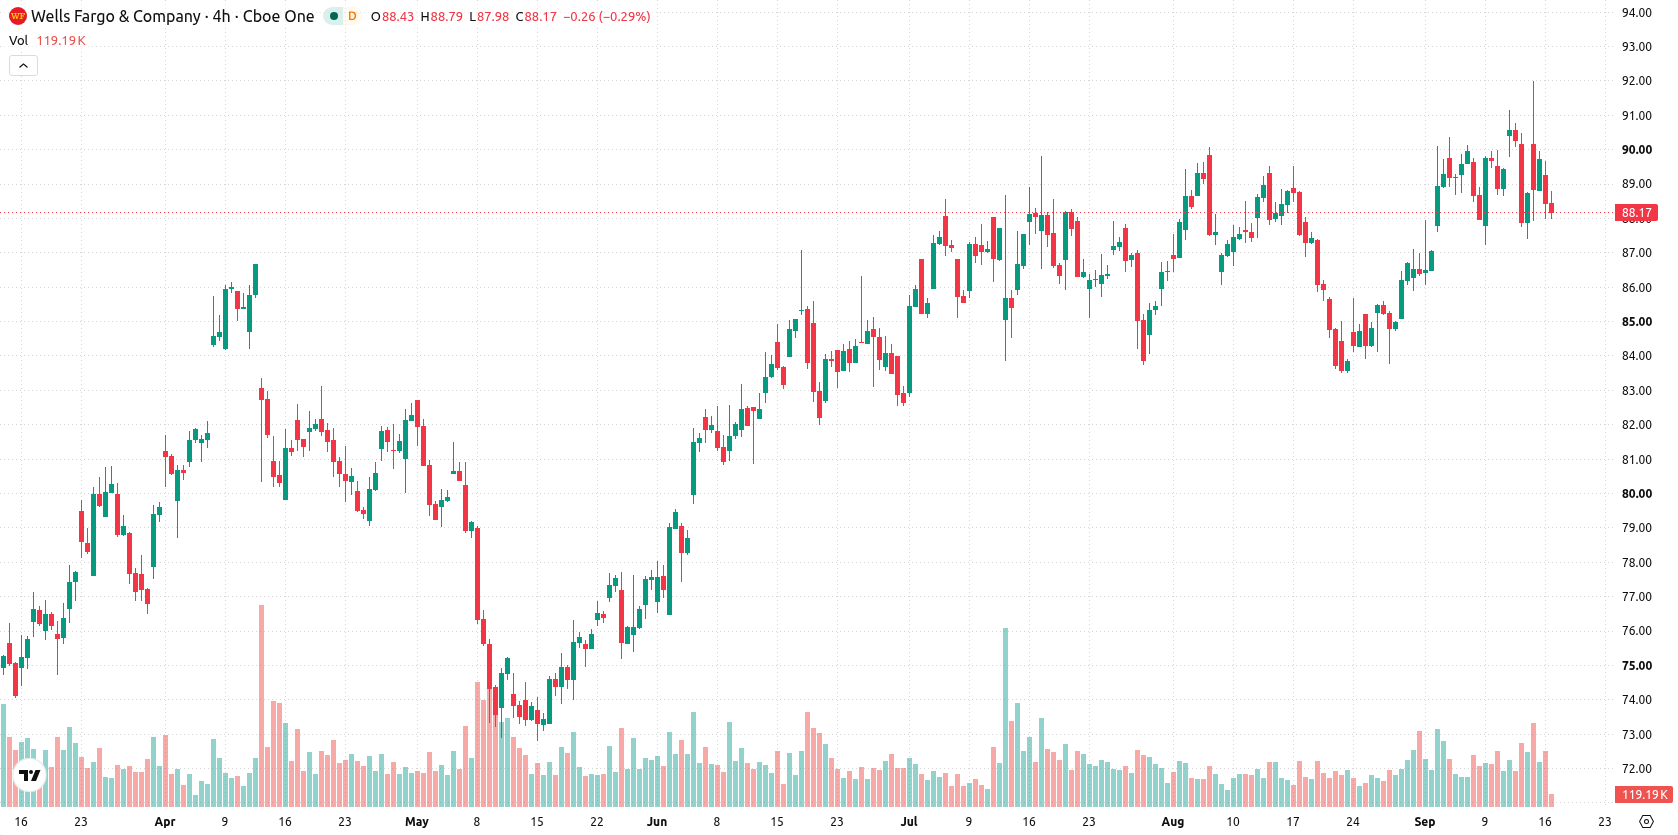
Wells Fargo & Company (WFC) declined 2.04% as sellers dominated early trading, even as the recent removal of its asset cap by the Federal Reserve in 2025 signaled greater operating flexibility for the bank. The bearish price action is now meeting emerging technical support above its 20-day, 50-day, and 200-day moving averages, which may limit further downside in the near term.
 86.85
86.85
Highlights
- The Federal Reserve lifted the asset cap on Wells Fargo in 2025, enabling growth as reported assets reached $2.28 trillion by June 30, 2026.
- Wells Fargo maintained robust preferred dividend coverage with a 23x net income-to-dividend ratio and 11x par coverage by common equity.
- Wells Fargo stock trades with bullish momentum above key technical levels, with a projected five-day range of $85.74 to $90.1.
Asset growth and strong coverage as equity view turns cautious
The Federal Reserve lifted the asset cap on Wells Fargo in 2025, providing the bank with increased flexibility to expand its balance sheet. Reported assets grew from $2.15 trillion at the end of 2025 to $2.28 trillion by June 30, 2026. The bank also maintained strong preferred dividend coverage with a net income-to-dividend ratio of 23x and par coverage by common equity of 11x, accompanied by a more cautious equity outlook from its chief strategist, who noted market headwinds including higher financing costs and regulatory challenges for AI data centers. Wells Fargo lowered its year-end S&P 500 target, though price action has remained under broader selling pressure.
Bullish bias faces mixed momentum at key resistance and support
WFC is trading above its 20-day, 50-day, and 200-day moving averages ($87.25, $87.19, and $85.16), confirming bullish momentum on all time frames. The Ichimoku Kijun at $87.75 provides immediate support, with a near-term resistance level at $87.95 just above current levels. Momentum indicators are mixed: MACD, RSI, and CCI support a bullish stance, but ADX and Stochastic RSI register as neutral. Intraday, Bull/Bear Power signals that buyers are still in control, although overbought conditions point to some near-term exhaustion. Volatility is moderate at 1.76%, and the stock is trading near today's lows after a downside gap.
Earlier, analysts noted that Wells Fargo’s price action was supported by strong institutional demand and improving technical momentum. The current analysis highlights emerging support above key moving averages and moderate volatility, with a decisive move above $87.95 or below $87.75 likely to determine the next trend in the days ahead.









-
 Afghanistan
-
 Albania
-
 Algeria
-
 Angola
-
 Argentina
-
 Armenia
-
 Australia
-
 Austria
-
 Azerbaijan
-
 Bahamas
-
 Bahrain
-
 Bangladesh
-
 Belarus
-
 Belgium
-
 Bolivia
-
 Botswana
-
 Brazil
-
 Brunei
-
 Bulgaria
-
 Cambodia
-
 Cameroon
-
 Canada
-
 Chile
-
 China
-
 Colombia
-
 Congo
-
 Costa Rica
-
 Cote d'Ivoire
-
 Croatia
-
 Cuba
-
 Cyprus
-
 Czechia
-
 DR Congo
-
 Denmark
-
 Dominican Republic
-
 Ecuador
-
 Egypt
-
 El Salvador
-
 Estonia
-
 Eswatini
-
 Ethiopia
-
 Finland
-
 France
-
 Georgia
-
 Germany
-
 Ghana
-
 Greece
-
 Haiti
-
 Hong Kong
-
 Hungary
-
 India
-
 Indonesia
-
 Iran, Islamic republic
-
 Iraq
-
 Ireland
-
 Israel
-
 Italy
-
 Jamaica
-
 Japan
-
 Jordan
-
 Kazakhstan
-
 Kenya
-
 Korea
-
 Kuwait
-
 Kyrgyzstan
-
 Laos
-
 Latvia
-
 Lebanon
-
 Lesotho
-
 Libya
-
 Lithuania
-
 Luxembourg
-
 Madagascar
-
 Malaysia
-
 Malta
-
 Mauritius
-
 Mexico
-
 Moldova
-
 Mongolia
-
 Montenegro
-
 Morocco
-
 Mozambique
-
 Myanmar
-
 Namibia
-
 Nepal
-
 Netherlands
-
 New Zealand
-
 Nigeria
-
 North Macedonia
-
 Norway
-
 Oman
-
 Pakistan
-
 Palestine
-
 Panama
-
 Papua New Guinea
-
 Paraguay
-
 Peru
-
 Philippines
-
 Poland
-
 Portugal
-
 Puerto Rico
-
 Qatar
-
 Reunion
-
 Romania
-
 Rwanda
-
 Saudi Arabia
-
 Serbia
-
 Singapore
-
 Slovakia
-
 Slovenia
-
 Somalia
-
 South Africa
-
 Spain
-
 Sri Lanka
-
 Sweden
-
 Switzerland
-
 Syria
-
 Taiwan
-
 Tajikistan
-
 Tanzania
-
 Thailand
-
 Trinidad and Tobago
-
 Tunisia
-
 Turkey
-
 UAE
-
 Uganda
-
 Ukraine
-
 United Kingdom
-
United States
-
 Uruguay
-
 Uzbekistan
-
 Venezuela
-
 Vietnam
-
 Yemen
-
 Zambia
-
 Zimbabwe
- Forex
- Crypto












