

Wells Fargo stock mixed as MACD turns bearish with RSI neutral: weekly analysis

Shares of Wells Fargo & Company (WFC) are trading near $82, having slipped by nearly 2% this week as the rally ran into short-term overbought territory. Despite generally constructive momentum since late spring, technical signals point to mixed sentiment as the stock pauses at the upper end of its recent range. Traders will be watching closely to see if support holds or if a bearish bias starts to build for the week ahead.
 84.86
85.48
Highlights
- Shares of Wells Fargo fell 1.72% over the past week to $82.39, trading near the lower end of the weekly range.
- Price action remains neutral to bearish as the stock sits below its 50-day and 200-day moving averages with contained volatility.
- The stock is likely to consolidate between $81.71 and $83.77 with a 63% chance of moving lower toward $78.2 if support breaks.
Earnings growth bolsters sentiment as buybacks accelerate despite revenue miss
Wells Fargo reported its third quarter 2026 financial results, with stronger earnings and profitability gains despite a modest revenue miss. According to CNBC, average loans grew by 11% year-over-year, while Simply Wall St and The The Motley Fool reported a 13% increase in earnings per share to about $1.87 and net income of approximately $5.95 billion. Management also reaffirmed full-year guidance and executed $2.5 billion in stock buybacks during the quarter, as highlighted by Yahoo Finance and TipRanks.
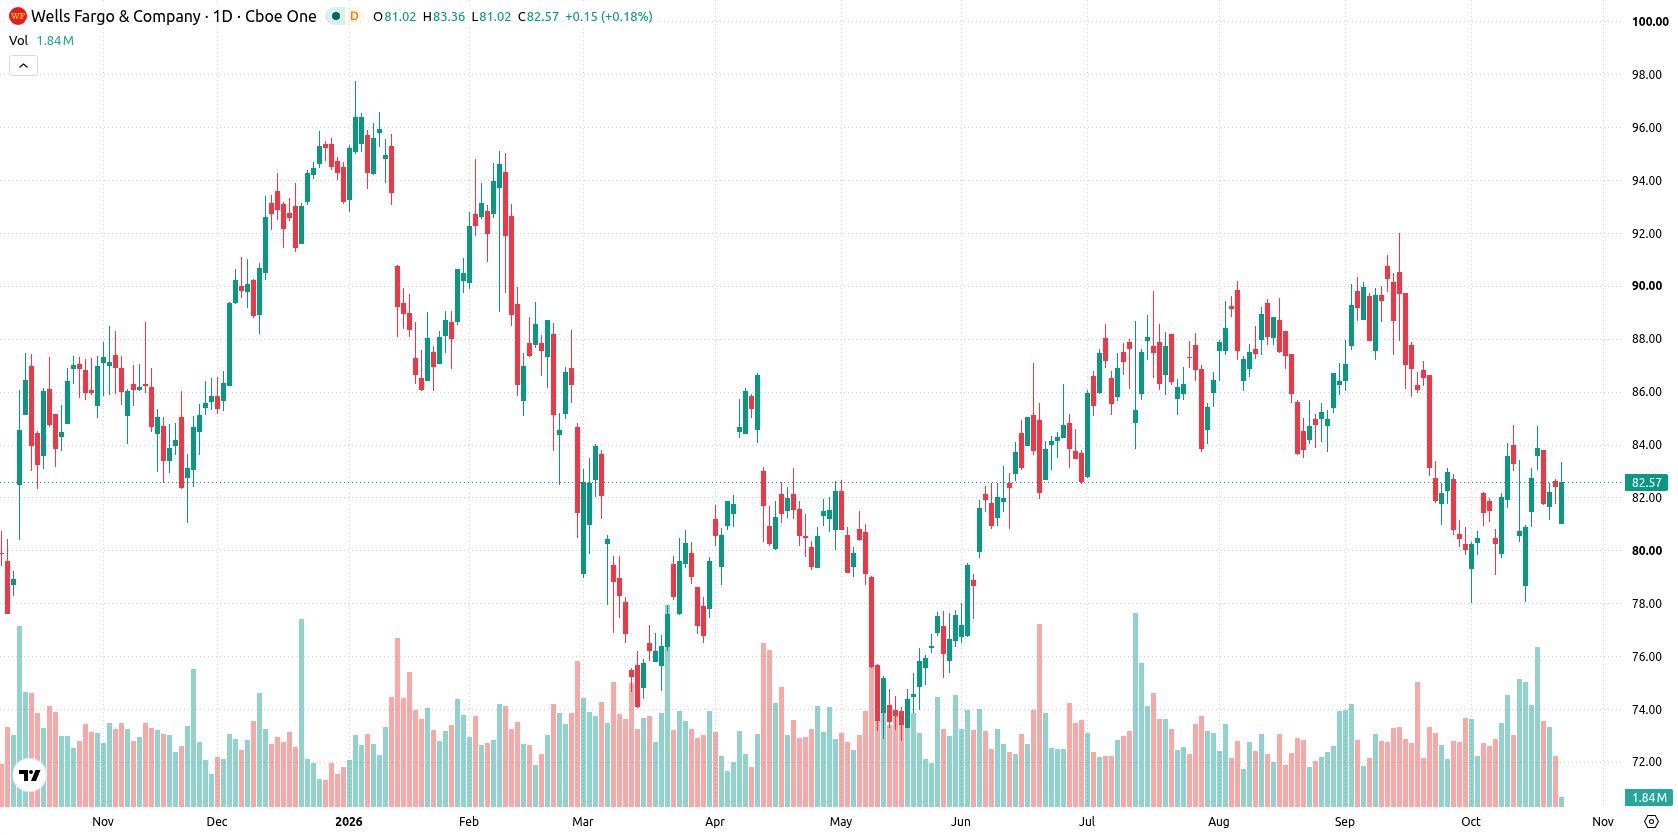
Bearish signals firm as MACD and oversold measures flag indecision
On the daily chart, Wells Fargo stock shows a flat trend, with price action forming a contained move within a narrow range as volatility reached 4.29% for the week. The MACD indicator points to a strong sell bias, while RSI sits at a neutral 47.73 and Bull/Bear Power is in an oversold state, highlighting mixed but slightly bearish momentum. Nearest support comes at $81.71 from the MA-20, while resistance is defined by the Ichimoku Kijun at $83.77. This setup suggests a market caught between downside momentum and local oversold conditions, echoing short-term indecision.
Range-bound outlook dominates with downside risk if support breaks next week
For the coming trading week, the expected range is $78.2 to $83.94, with a 37% probability of an increase and a 63% probability of a decrease. The base case is for the stock to consolidate between $81.71 and $83.77. A break above $83.77 would target the upper end of the forecast range, while a move below $81.71 would expose downside risk toward $78.2.
Earlier, analysts noted that Wells Fargo was under persistent pressure amid technical weakness and underwhelming revenue performance. The current analysis highlights a shift to mixed momentum with support in focus, and traders should watch for a decisive move outside the $81.71 to $83.77 range to gauge the next directional bias.






Latest Wells Fargo News



-
 Afghanistan
-
 Albania
-
 Algeria
-
 Angola
-
 Argentina
-
 Armenia
-
 Australia
-
 Austria
-
 Azerbaijan
-
 Bahamas
-
 Bahrain
-
 Bangladesh
-
 Belarus
-
 Belgium
-
 Bolivia
-
 Botswana
-
 Brazil
-
 Brunei
-
 Bulgaria
-
 Cambodia
-
 Cameroon
-
 Canada
-
 Chile
-
 China
-
 Colombia
-
 Congo
-
 Costa Rica
-
 Cote d'Ivoire
-
 Croatia
-
 Cuba
-
 Cyprus
-
 Czechia
-
 DR Congo
-
 Denmark
-
 Dominican Republic
-
 Ecuador
-
 Egypt
-
 El Salvador
-
 Estonia
-
 Eswatini
-
 Ethiopia
-
 Finland
-
 France
-
 Georgia
-
 Germany
-
 Ghana
-
 Greece
-
 Haiti
-
 Hong Kong
-
 Hungary
-
 India
-
 Indonesia
-
 Iran, Islamic republic
-
 Iraq
-
 Ireland
-
 Israel
-
 Italy
-
 Jamaica
-
 Japan
-
 Jordan
-
 Kazakhstan
-
 Kenya
-
 Korea
-
 Kuwait
-
 Kyrgyzstan
-
 Laos
-
 Latvia
-
 Lebanon
-
 Lesotho
-
 Libya
-
 Lithuania
-
 Luxembourg
-
 Madagascar
-
 Malaysia
-
 Malta
-
 Mauritius
-
 Mexico
-
 Moldova
-
 Mongolia
-
 Montenegro
-
 Morocco
-
 Mozambique
-
 Myanmar
-
 Namibia
-
 Nepal
-
 Netherlands
-
 New Zealand
-
 Nigeria
-
 North Macedonia
-
 Norway
-
 Oman
-
 Pakistan
-
 Palestine
-
 Panama
-
 Papua New Guinea
-
 Paraguay
-
 Peru
-
 Philippines
-
 Poland
-
 Portugal
-
 Puerto Rico
-
 Qatar
-
 Reunion
-
 Romania
-
 Rwanda
-
 Saudi Arabia
-
 Serbia
-
 Singapore
-
 Slovakia
-
 Slovenia
-
 Somalia
-
 South Africa
-
 Spain
-
 Sri Lanka
-
 Sweden
-
 Switzerland
-
 Syria
-
 Taiwan
-
 Tajikistan
-
 Tanzania
-
 Thailand
-
 Trinidad and Tobago
-
 Tunisia
-
 Turkey
-
 UAE
-
 Uganda
-
 Ukraine
-
 United Kingdom
-
United States
-
 Uruguay
-
 Uzbekistan
-
 Venezuela
-
 Vietnam
-
 Yemen
-
 Zambia
-
 Zimbabwe
- Forex
- Crypto












